What is Power Query?
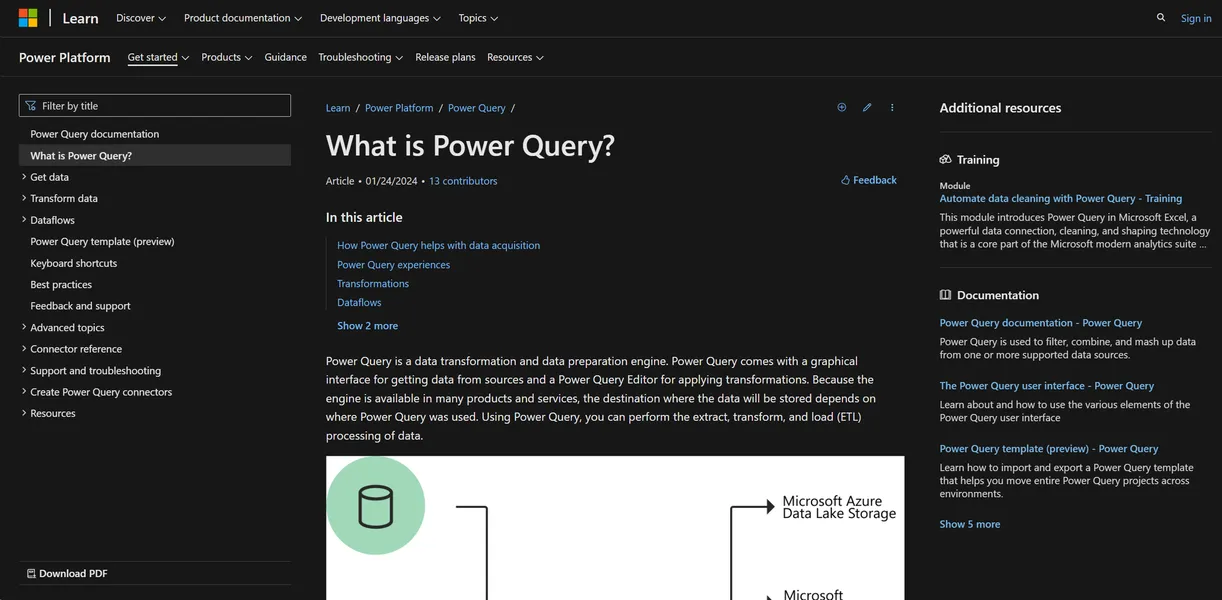
Power Query is an extraction and transformation engine hidden inside the Microsoft products you already use. It takes messy data from local files or cloud databases and turns it into clean tables. You click through a visual ribbon to filter rows, merge tables, and fix data types.
You never have to copy and paste data again.
Microsoft Corporation built this tool for business analysts and data workers. It solves the manual nightmare of Excel reporting. You connect to a source once, build your cleaning steps, and refresh the data next month. But the interface hides a complex functional language called M.
- Primary Use Case: Cleaning and merging messy Excel spreadsheets into structured tables for analysis.
- Ideal For: Business analysts working within the Microsoft ecosystem.
- Pricing: Starts at $17 (Pro): Premium tiers add AI features and higher usage limits.
Key Features and How Power Query Works
Data Connections and Ingestion
- Connectors: Access 100+ sources like SQL and Salesforce. Limit: Custom API connections often require writing manual M code.
- Query Folding: Pushes transformation logic back to SQL servers. Limit: Breaks easily if you use non-foldable steps (I learned this the hard way when a simple index column broke my SQL query folding).
Visual Data Preparation
- Graphical Interface: Ribbon-based UI for sorting and type conversion. Limit: Cannot handle complex conditional logic without custom formulas.
- Data Profiling: Shows distribution charts and quality indicators. Limit: Only profiles the first 1000 rows by default.
Advanced Manipulation
- M Formula Language: Case-sensitive functional language for complex ETL. Limit: Cryptic error messages make debugging difficult for beginners.
- Merge/Append: Joins tables using standard SQL-like joins. Limit: Fuzzy matching consumes massive memory on large datasets (expect frequent crashes on older laptops).
Power Query Pros and Cons
Pros
- Native integration with Excel and Power BI makes it the standard for Microsoft users.
- The Applied Steps pane allows for easy auditing and undoing of specific transformation stages.
- Handles large datasets efficiently by using a streaming engine rather than loading everything into RAM.
- Extensive community support and documentation provide solutions for almost any data cleaning scenario.
Cons
- The M language has a steep learning curve for users wanting to go beyond the basic visual features.
- Error messages lack clarity, often requiring deep investigation into the M code to identify the failure point.
- Performance degrades significantly when dealing with complex transformations on non-foldable data sources.
- Lacks proper version control like Git within the native desktop interface.
Who Should Use Power Query?
- Excel Power Users: Automate monthly reporting tasks without writing VBA macros.
- Power BI Developers: Build the foundational data models required for dashboard reporting.
- Mac Users: This is not a good fit. The full desktop authoring experience remains limited or absent on macOS versions of Excel.
Power Query Pricing and Plans
Microsoft offers a freemium model for Power Query features. The free tier is real for basic desktop use, but cloud dataflows require premium licenses.
- Free: $0/mo. Basic access with standard usage limits.
- Pro: $17/mo. 5x usage of Free tier with advanced features.
- Max: $100/mo. Very high usage limits for power users.
- Team: $25/user/mo. Standard seats for business collaboration.
- Premium Team: $150/mo. Includes developer environment.
- Enterprise: Custom pricing. Contact sales for large deployments.
How Power Query Compares to Alternatives
Similar to Alteryx, Power Query cleans and blends data from multiple sources. But Alteryx offers spatial analytics and a visual drag-and-drop canvas. Power Query relies on a linear step-by-step list. Alteryx costs thousands of dollars per user. Power Query comes included with standard Microsoft licenses or cheap premium add-ons.
Unlike Talend, Power Query targets business analysts rather than data engineers. Talend handles massive big data pipelines better. It offers native Java integration and complex orchestration. Power Query wins on Excel integration and ease of use for non-technical staff.
The Microsoft Analyst Verdict
Power Query delivers massive value to anyone stuck doing manual data entry in Excel. Business analysts get the most benefit. You can automate your entire monthly reporting cycle with a few clicks. But data engineers building enterprise pipelines should look elsewhere.
The lack of Git integration makes team collaboration difficult.
If you need visual workflow mapping, try Alteryx instead. Still, Power Query remains the default choice for Microsoft shops. The honest limit lies in the M language. You will eventually hit a wall with the visual ribbon. When that happens, you must learn a highly specific coding language just to filter a complex table.