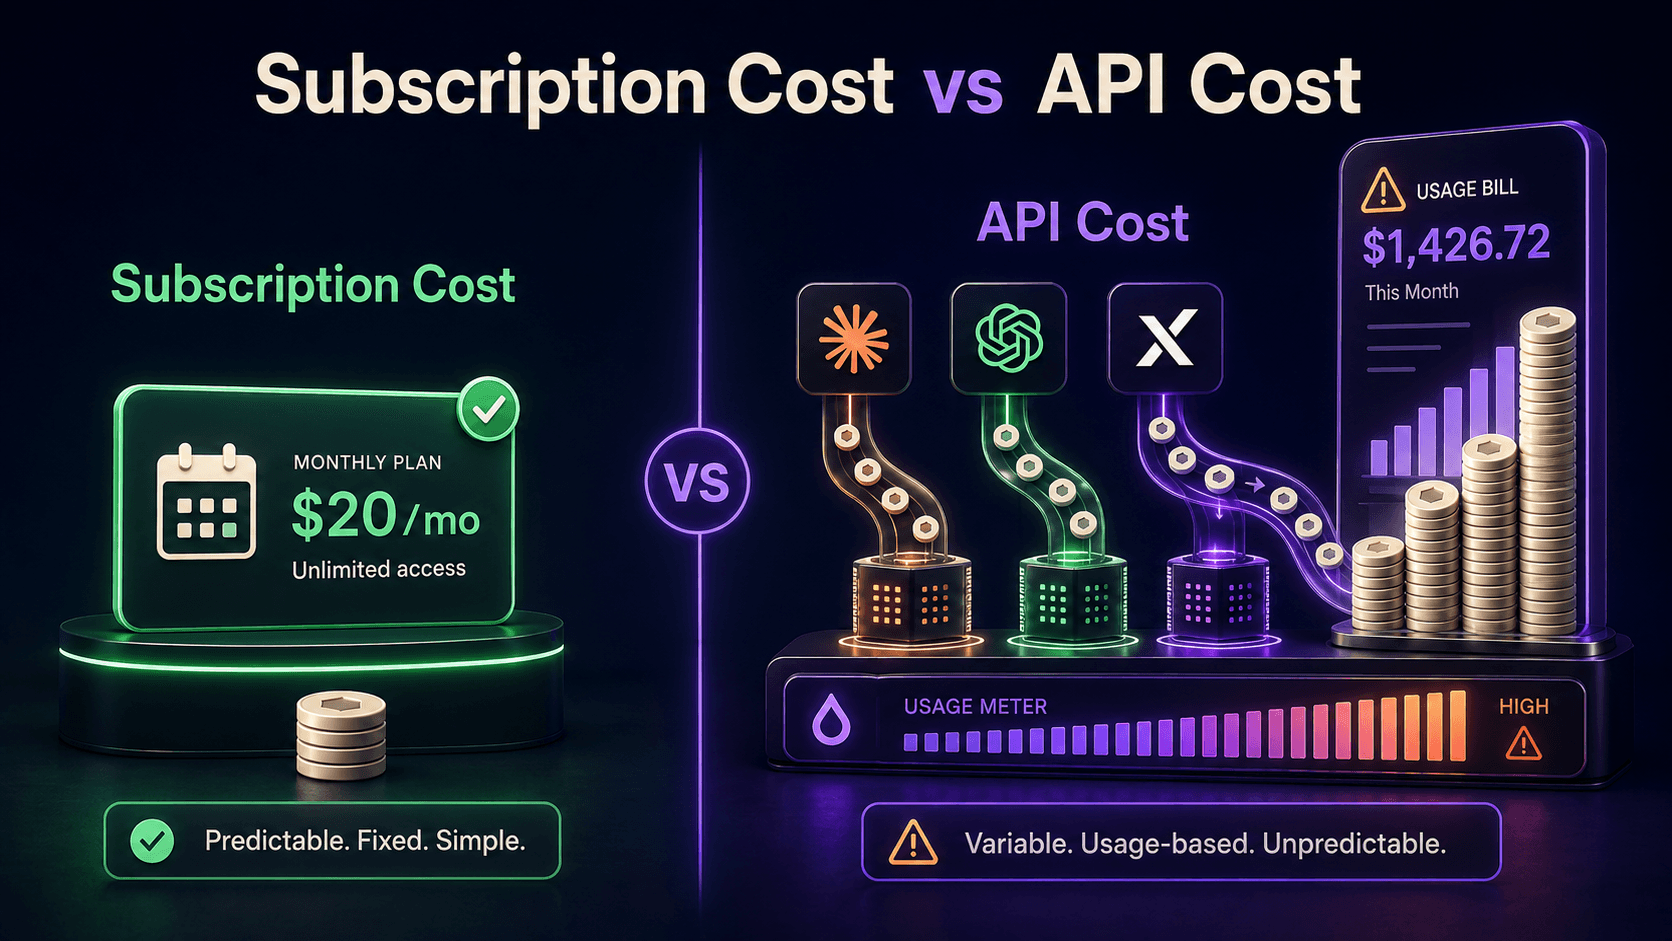
Coding Ate Enterprise AI (2026): The $4B Use Case, Anthropic’s Share, and Seat vs API Math
# Coding Ate Enterprise AI (2026): The $4B Use Case, Anthropic’s Share, and Seat vs API Math
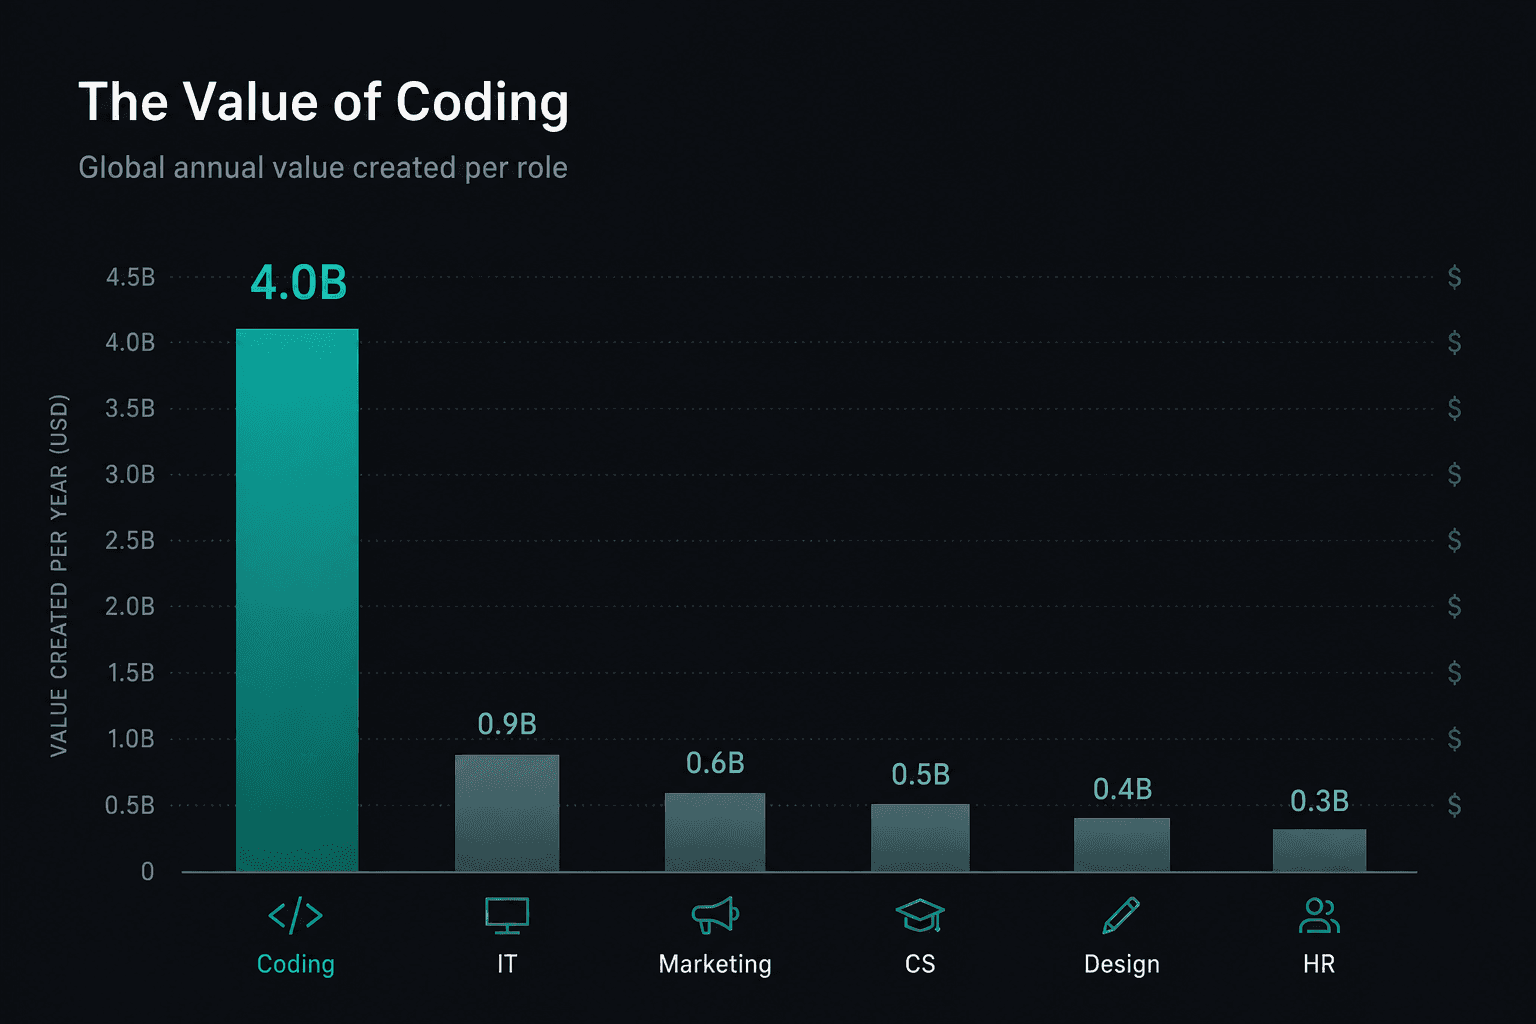
Coding did not “win” enterprise generative AI in a branding contest. It won because buyers can measure it. Menlo Ventures’ bottoms-up model puts coding AI apps at $4.0B in 2025 - 55% of departmental AI - after a jump from $550M the year before. Half of developers report daily AI coding tool use; top-quartile orgs hit 65%. Self-reported velocity gains start at 15%+. Those are survey and market-model numbers, not a vendor demo reel. As of 2 September 2026, this is the operator map: where the dollars went, who captured production API share, what official seat and token prices actually say, why SWE-bench Verified is a saturated scoreboard, and a labeled method/illustration of seat vs API total cost for a 20-developer team.
Some product links may earn a commission. That does not change the arithmetic. We also list tools in the Vantaige directory; weigh that bias if you see a listing.
Table of contents
1. TL;DR
9. FAQ
10. References
TL;DR {#tldr}
Menlo (Dec 2025): enterprise GenAI $37B in 2025; departmental AI $7.3B; coding $4.0B (55%); category from $550M → $4B; daily AI coding use 50% of developers (65% top-quartile); velocity 15%+ self-reported; Cursor narrative of $200M revenue before first enterprise sales hire.
Menlo production API $ share: Anthropic 40% enterprise LLM (was 24% in 2024, 12% in 2023); OpenAI 27%; Google 21%; open-weight 11%. Anthropic coding share ~54%; OpenAI coding ~21%.
Official seats (accessed / compiled 2026-09-02 in research dump): Cursor Pro $20/mo, Pro+ $60, Ultra $200, Teams $40/user/mo; Claude Pro ~$17-20/mo, Team Standard $20/seat/mo annual, Team Premium $100/seat/mo annual, Enterprise $20/seat + API; ChatGPT Plus $20/mo, Go $8/mo, Pro $100 or $200, Business $20/user/mo annual ($25 monthly).
API anchors (official pages in dump): Claude Opus 5 $5 / $25 per 1M in/out; Sonnet 5 $2 / $10; Fable 5 $10 / $50; GPT-5.6 Sol (Standard extract) ~$4 / $20 - re-verify live HTML before you sign.
SWE-bench Verified: frontier cluster widely reported ~95-97% - treat as near-saturated; prefer dated harnesses (SWE-bench Pro / Scale SEAL) over frozen marketing slides.
TCO section below is a method/illustration using those public prices and assumed token volumes - not a Menlo or vendor survey result.
The $4B category (Menlo, defined) {#the-4b-category}
Publisher: Menlo Ventures - *2025: The State of Generative AI in the Enterprise* (Dec 9, 2025).
Method: survey of 495 U.S. enterprise AI decision-makers (Nov 7-25, 2025) plus a bottoms-up market model.
Scope exclusions that matter: chips (e.g., Nvidia), hyperscaler inference/serving, and AI features bolted into existing non-AI software. 2023/2024 figures were restated excluding inference for comparability.
| Layer (Menlo 2025) | Figure | Notes |
|---|---|---|
| Enterprise GenAI total | $37B | 3.2× vs restated 2024 $11.5B (2023 restated $1.7B) |
| Application layer | $19B | >50% of GenAI |
| Infrastructure layer (Menlo definition) | $18B | Was $9.2B in 2024 |
| Departmental AI | $7.3B | 4.1× YoY |
| Coding (departmental) | $4.0B | 55% of departmental |
| Prior coding size | $550M | Same Menlo series - category jump in 2025 |
Inside departmental AI, coding is not “one of several peers.” IT is $700M, marketing $660M, customer support $630M, with design and HR smaller shares in Menlo’s cut. Horizontal copilots are a different box ($7.2B, 86% of horizontal AI). Do not paste coding dollars into the horizontal copilot line and call it one market.
Menlo also reports ≥10 products above $1B ARR and ≥50 above $100M ARR in the broader GenAI stack, 76% of enterprise AI spend purchased rather than built, and AI deal conversion to production at 47% vs 25% for traditional SaaS. Coding sits inside that purchased, high-conversion world - Cursor’s PLG path is the clearest public narrative Menlo highlights ($200M revenue before the first enterprise sales hire).
Players commonly named in the same Menlo framing: Cursor, Claude Code, GitHub Copilot, Codex, OpenHands, Lovable (app builders), Graphite, and peers. Naming is not a ranking. Ranking requires your repo, your compliance box, and your seat math.
Why coding cleared the ROI bar first {#why-coding-cleared-roi}
Enterprise GenAI has a measurement problem. McKinsey’s State of AI 2026 cut (survey May 4 - Jun 8, 2026; n=1,719) still shows only 37% of orgs reporting any positive EBIT contribution from AI, and ~6% as “high performers.” MIT NANDA / MLQ’s GenAI Divide report frames 95% of orgs as getting zero measurable P&L return from GenAI pilots - a P&L claim, not “models don’t work.” Coding is the exception buyers can feel in sprint velocity without waiting for a finance attribution model.
Menlo’s behavioral hooks:
| Stat | Figure | Caveat |
|---|---|---|
| Daily AI coding tool use | 50% of developers | Self-report |
| Top-quartile orgs | 65% daily | Same survey family |
| Reported velocity gain | 15%+ | Self-reported - not an independent time-motion study |
That combination - high daily use, measurable shipping speed, and a clear departmental budget owner (engineering) - is why coding absorbed $4B while ambient healthcare scribes ($600M) and legal vertical AI (~$650M) stay smaller vertical slices in the same Menlo year. Coding also rides PLG: individual developers adopt, then finance consolidates seats. Menlo puts PLG at 27% of AI app spend (vs ~7% traditional software), and higher if you count shadow AI.
Workflow redesign still matters. McKinsey’s high performers redesigned workflows at ~75% vs ~25% for others. Buying Cursor or Claude seats without changing PR review, CI, and on-call ownership is how you get “we have AI” without “we ship faster.”
Anthropic’s share: enterprise 40%, coding ~54% {#anthropic-share}
Menlo’s enterprise LLM table is production API dollar share, not download share and not Chatbot Arena Elo.
| Provider | Enterprise LLM spend share (Menlo Dec 2025) | Trend note |
|---|---|---|
| Anthropic | 40% | Was 24% (2024), 12% (2023) |
| OpenAI | 27% | Was ~50% (2023) |
| 21% | Was 7% (2023) | |
| Other / open | 12% combined | Meta Llama, Cohere, Mistral, long tail |
| Open-weight share of enterprise | 11% | Down from 19% prior year |
| Chinese open models in enterprise | ~1% of total LLM API usage | Higher among startups (OpenRouter/vLLM signals) |
Coding-specific cut (same Menlo report): Anthropic coding share ~54%; OpenAI coding ~21%.
Read that carefully. Anthropic’s 40% is overall enterprise LLM API dollars. The ~54% is the coding slice. Both can be true if coding is where Anthropic over-indexes relative to its already-leading enterprise share. Open-weight models can look strong on SWE-bench aggregator boards and still sit at 11% of enterprise production API spend - Menlo’s buyer-side dollars, not hobbyist tokens.
Implication for stack design: if your engineering org is the primary GenAI budget, Anthropic’s coding share is a demand signal, not a mandate. Multi-model routing still makes sense for cost tiers (Haiku / Luna-class) and for vendor risk. Just do not pretend “everyone uses OpenAI” is still the 2023 default in production API dollars.
Official price cards: Cursor, Claude, ChatGPT {#official-prices}
Prices below are from the Vantaige research dump’s primary-page extracts (access / compile date 2026-09-02). Re-check the live vendor pages before you put a number on an order form - especially OpenAI’s JS-heavy API table.
Cursor (cursor.com/pricing)
| Plan | Price |
|---|---|
| Hobby | $0 |
| Pro | $20/mo |
| Pro+ | $60/mo (3× Agent limits) |
| Ultra | $200/mo (20× Agent limits) |
| Teams | $40/user/mo |
| Enterprise | Custom |
Claude / Anthropic (anthropic.com/pricing)
Subscriptions (primary):
| Plan | Price (as compiled) |
|---|---|
| Pro | $17/mo annual display (monthly commonly $20/mo) |
| Max | From $100 (5×); secondary maps 20× to $200 |
| Team Standard | $20/seat/mo annual ($25 monthly) |
| Team Premium | $100/seat/mo annual ($125 monthly) |
| Enterprise | $20/seat + usage at API rates (annual) |
API (per 1M tokens):
| Model | Input | Output |
|---|---|---|
| Fable 5 | $10 | $50 |
| Opus 5 | $5 | $25 |
| Sonnet 5 | $2 | $10 |
Batch = 50% off. Prompt caching published per model. Managed Agents add token rates + $0.08 / session-hour active runtime. Opus 5 fast mode = 2× standard pricing.
ChatGPT (openai.com/chatgpt/pricing)
| Plan | Price (US, reported/official in dump) |
|---|---|
| Free | $0 |
| Go | $8/mo |
| Plus | $20/mo |
| Pro | $100 (5×) or $200 (20×) |
| Business | $20/user/mo annual or $25 monthly (min seats apply) |
| Enterprise | Custom |
OpenAI API (Standard extract - re-verify)
| Model (Standard) | Input | Cached input | Output (approx) |
|---|---|---|---|
| gpt-5.6-sol | $4.00 | $0.40 | $20.00 |
| gpt-5.6-terra | $2.00 | $0.20 | $12.00 |
| gpt-5.6-luna | $0.20 | $0.02 | $1.20 |
Secondary blogs quoting Sol at $5/$30 may mix Priority or older snapshots - prefer platform.openai.com/docs/pricing.
Worked 20-dev TCO (method / illustration) {#tco-20-dev}
Label this entire section as method / illustration. Seat line items use official list prices from the cards above. Token volumes, mix of input/output, cache hit rates, and “power user” fractions are assumptions for arithmetic, not Menlo survey means and not vendor-reported averages. Replace every assumption with your telemetry before you budget.
Assumptions (illustrative - replace with your logs)
| Assumption | Value used here | Why it is labeled |
|---|---|---|
| Headcount | 20 developers | Scenario size |
| Heavy agent users | 5 of 20 | Upgrade pressure on Cursor Pro→Pro+/Ultra |
| Standard IDE-seat users | 15 of 20 | Teams / Pro / Business seats |
| Agent-heavy monthly tokens (per heavy user) | 40M input + 8M output | Multi-step agentic burn; not a published average |
| Light monthly tokens (per standard user) | 8M input + 1.5M output | Autocomplete + chat |
| Cache / batch effective discount on input | 50% of input billed at cache/batch-like rates in “optimized” column | Anthropic batch = 50% off; OpenAI cached input listed separately - simplified |
| Model for API column | Claude Sonnet 5 at $2 / $10 | Mid-tier coding workhorse on Anthropic card |
| Alt API column | Claude Opus 5 at $5 / $25 | Complex agentic coding tier |
| Alt OpenAI column | GPT-5.6 Sol Standard $4 / $20 | Primary-page extract |
Token burn (illustrative monthly)
Heavy cohort: 5 × (40M in + 8M out) = 200M in + 40M out
Standard cohort: 15 × (8M in + 1.5M out) = 120M in + 22.5M out
Team total / month: 320M input + 62.5M output tokens
Monthly API cost math (illustrative)
Sonnet 5 raw:
320M × $2/M + 62.5M × $10/M = $640 + $625 = $1,265 / mo
Sonnet 5 optimized (assume 50% of input at half price via cache/batch-like treatment):
Input effective ≈ 160M × $2 + 160M × $1 = $320 + $160 = $480; output still $625 → $1,105 / mo
Opus 5 raw:
320M × $5 + 62.5M × $25 = $1,600 + $1,562.50 = $3,162.50 / mo
Sol Standard raw:
320M × $4 + 62.5M × $20 = $1,280 + $1,250 = $2,530 / mo
Seat scenarios (list prices × 20, monthly)
| Scenario | How built | Monthly (list) | Annual (×12) |
|---|---|---|---|
| A. Cursor Teams × 20 | 20 × $40 | $800 | $9,600 |
| B. Cursor mix (15 Pro + 5 Ultra) | 15×$20 + 5×$200 | $1,300 | $15,600 |
| C. Cursor mix (15 Pro + 5 Pro+) | 15×$20 + 5×$60 | $600 | $7,200 |
| D. Claude Team Standard × 20 | 20 × $20 annualized seat | $400 | $4,800 |
| E. Claude Team Premium × 20 | 20 × $100 annualized seat | $2,000 | $24,000 |
| F. Claude Enterprise seats only | 20 × $20 | $400 | $4,800 |
| G. ChatGPT Business × 20 | 20 × $20 annual | $400 | $4,800 |
| H. ChatGPT Plus × 20 (individual) | 20 × $20 | $400 | $4,800 |
Combined TCO table (method / illustration)
| Stack pattern | Seats / mo | API / mo (model) | **Total / mo** | **Total / yr** | What you are actually buying |
|---|---|---|---|---|---|
| Cursor Teams only | $800 | $0 (included limits; overages not modeled) | $800 | $9,600 | Predictable seats; agent limit risk → Pro+/Ultra |
| Cursor mix Pro+ heavy | $600 | $0 | $600 | $7,200 | Lower sticker than Ultra mix; still cap-bound |
| Cursor Ultra heavy mix | $1,300 | $0 | $1,300 | $15,600 | Power-user ceiling on Cursor ladder |
| Claude Enterprise seats + Sonnet API (raw) | $400 | $1,265 | $1,665 | $19,980 | Menlo-style “$20 + metered” coupling |
| Claude Enterprise + Sonnet optimized | $400 | $1,105 | $1,505 | $18,060 | Same coupling with cache/batch discipline |
| Claude Enterprise + Opus API (raw) | $400 | $3,162.50 | $3,562.50 | $42,750 | Frontier agentic coding tokens |
| Claude Team Premium only | $2,000 | $0 (usage inside tier; overages not modeled) | $2,000 | $24,000 | High seat, less visible token line |
| ChatGPT Business only | $400 | $0 | $400 | $4,800 | Horizontal seat - not a full IDE agent substitute |
| Pure API Sonnet (no seats) | $0 | $1,265 | $1,265 | $15,180 | DIY IDE / CLI / OpenHands-style |
| Pure API Sol (no seats) | $0 | $2,530 | $2,530 | $30,360 | Same DIY shape on OpenAI Standard extract |
How to use this table:
1) Instrument real tokens for two weeks.
2) Split power users from ambient users.
3) Compare Cursor’s limit-driven upgrades (Pro → Pro+ → Ultra) against Claude Enterprise’s explicit $20 + API.
4) Do not treat ChatGPT Business $20/seat as equivalent to Cursor Teams $40/seat - different product, different agent surface.
5) Menlo’s Jevons note still applies: falling inference prices can raise net spend via volume. Your optimized column can still grow if agents run longer.
Finance-friendly one-liner: for this illustrative 20-dev token load, Claude Enterprise + Sonnet lands near ~$1.5-1.7k/mo, Cursor Teams near $800/mo before limit upgrades, and Opus-heavy API can clear $3.5k/mo with seats. Your logs will move every cell.
SWE-bench saturation flag {#swe-bench}
SWE-bench Verified is widely reported as near-saturated at the frontier, with a top cluster around ~95-97%. That is a warning label for buyers, not a victory lap for any single vendor.
Illustrative Verified scores from aggregator boards (Jul-Sep 2026) in the research dump - conflicting; do not treat as official:
| Model | Reported SWE-bench Verified | Board examples |
|---|---|---|
| Claude Opus 5 | 96-97% | OpenLM.ai, vals.ai / modelfit, BenchLM |
| GPT-5.6 Sol | ~96.2% | Same cluster |
| Claude Fable 5 | ~95% | Same cluster |
| DeepSeek-V4-Pro (some boards) | ~96.4% | Conflicts with Anthropic-led boards |
| Grok 4.5 | ~86.6% (earlier) / higher on newer boards | Varies by date |
Writer / buyer rules from the dump:
Vendor-scaffold scores ≠ standardized harness scores.
Prefer Scale SEAL / SWE-bench Pro (and dated vendor model cards) when you need differentiation.
LMSYS Chatbot Arena Elo changes weekly - link the live board; do not freeze a single Elo into evergreen copy.
Primary-ish hubs: swebench.com, openlm.ai/swe-bench.
If three frontier models all sit in the mid-90s on Verified, your procurement scorecard should weight repo-local evals, latency, tool-use reliability, indemnity, and unit economics - not a 0.4-point leaderboard delta from a blog screenshot.
What to buy, what to skip {#buy-skip}
Buy / pilot when:
Engineering owns a departmental GenAI budget and can measure PR cycle time, revert rate, and escaped defects.
You can run a two-week token telemetry pilot before annualizing seats.
You need PLG adoption (Cursor-style) or explicit seat+API metering (Claude Enterprise) rather than a vague “AI transformation” SOW.
Your compliance path accepts the chosen vendor’s training / retention terms for source code.
Skip / postpone when:
The business case is “SWE-bench says 96%” with no internal harness.
You plan to give every employee ChatGPT Business and call it a coding platform.
You cannot name an owner for evals, secret scanning, and license policy on generated code.
Finance wants a single blended “AI seat” that mixes horizontal copilots (Menlo horizontal $7.2B world) with IDE agents ($4B coding world) - keep the budget lines separate.
Stack pattern that matches 2026 reality: many orgs will run Cursor or Copilot-class IDE seats for daily UX and Anthropic/OpenAI API for agents, CI bots, and custom workflows. Menlo’s 76% purchased and 47% AI-to-production conversion favor buying the UX layer; the TCO table shows why the API layer still needs a meter.
FAQ {#faq}
Is coding really 55% of departmental AI?
In Menlo’s Dec 2025 enterprise GenAI report, departmental AI is $7.3B and coding is $4.0B, which is 55% of that departmental slice - not 55% of all enterprise GenAI ($37B).
Did Anthropic “win” enterprise AI?
Menlo’s production API dollar share puts Anthropic at 40% overall enterprise LLM spend and ~54% in coding. That is leadership in measured API dollars for that survey window - not a monopoly, and not identical to end-user chat share.
Should I use SWE-bench to pick a vendor?
Use it as a hygiene check, not a winner-take-all score. Verified is near-saturated (~95-97% cluster). Prefer dated independent harnesses and your own repo evals.
Is the 20-dev TCO a real average cost?
No. It is a method/illustration that multiplies official list prices by assumed token volumes. Replace assumptions with your logs.
Why is Cursor Teams $40 but Claude Team Standard $20?
Different products and limits. Cursor’s ladder explicitly prices Agent limit multipliers (Pro+ $60, Ultra $200). Claude Team/Enterprise pricing couples seats with API metering on the Enterprise path ($20 + API). Compare workflows, not sticker alone.
Where does GitHub Copilot fit?
Named among common players in Menlo’s coding category narrative. This article’s priced TCO focuses on Cursor / Claude / ChatGPT cards captured in the research dump; pull Copilot’s current seat card from Microsoft before adding a row.
References {#references}
1. Menlo Ventures - *2025: The State of Generative AI in the Enterprise* (Dec 9, 2025): https://menlovc.com/perspective/2025-the-state-of-generative-ai-in-the-enterprise/
2. Menlo PDF: https://menlovc.com/wp-content/uploads/2025/12/menlo_ventures_enterprise_ai_report-2025-123125.pdf
3. Anthropic pricing: https://www.anthropic.com/pricing
4. Cursor pricing: https://www.cursor.com/pricing
5. OpenAI ChatGPT pricing: https://openai.com/chatgpt/pricing
6. OpenAI API pricing: https://platform.openai.com/docs/pricing
7. SWE-bench: https://www.swebench.com/
8. OpenLM SWE-bench board: https://openlm.ai/swe-bench/
9. McKinsey State of AI 2026 context (survey window May 4 - Jun 8, 2026; n=1,719) - via Business Review / TechTimes summaries cited in Vantaige research dump
10. MIT NANDA / MLQ - *The GenAI Divide: State of AI in Business 2025*: https://mlq.ai/media/quarterly_decks/v0.1_State_of_AI_in_Business_2025_Report.pdf
11. Internal stats compilation:
/workspace/vantaige-ai-market-research-2026.md(compiled 2026-09-02)
Related from Vantaige {#related}
Vantaige AI cost / token calculators - for live seat vs token sketches after you replace the illustrative volumes above
Directory coding / IDE agent listings - verify each vendor’s current limits before you treat a review card as a quote
Companion deep dives (Sep 2026 series): Three AI Markets Problem; Agentic ROI Gap; GEO After the Rankings Divorce; Buy Don’t Build + EU Art 50
Get the best new AI tools and guides, weekly
One short email a week. The tools worth trying, the guides worth reading, nothing else.
No spam. Unsubscribe anytime.
Aymen B
Contributing writer at Vantaige, covering the AI tools ecosystem.