The Three AI Markets Problem (2026): Gartner $2.59T vs IDC Hardware vs Stanford Investment vs Menlo Enterprise GenAI
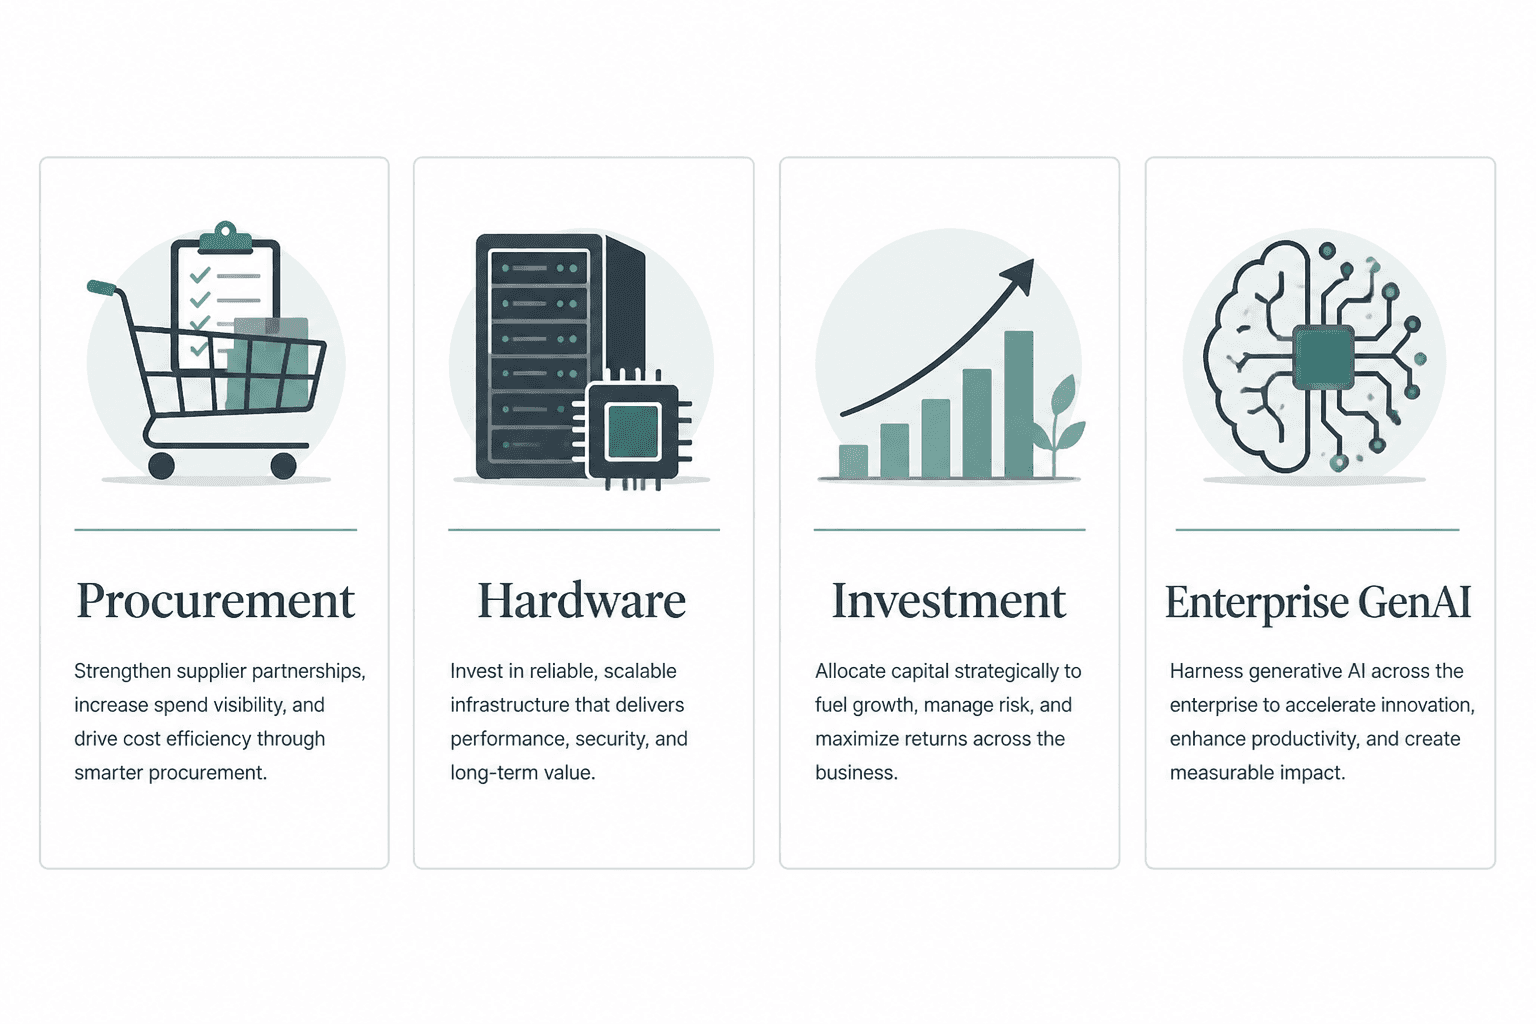
# The Three AI Markets Problem (2026): Gartner $2.59T vs IDC Hardware vs Stanford Investment vs Menlo Enterprise GenAI
You do not have an “AI market size” problem. You have a category-error problem. Four widely cited 2025-2026 headlines - Gartner’s $2.59T, IDC’s $487B, Stanford’s $581B, and Menlo’s $37B - measure different economic flows. Blending them into one “total AI market” is how you ship a board slide that dies in diligence.
This is the operator explainer: what each series measures, the numbers you can cite without inventing, a decision rule for which number belongs in which claim, and the Appendix A M01-M14 cheatsheet. Math first. Adjectives last.
Table of contents
1. TL;DR
11. FAQ
12. References
TL;DR {#tldr}
Never blend. Gartner $2,595.7B (2026f) is full-stack procurement spend. IDC $487B (2026f) is hardware only. Stanford $581B is 2025 actual corporate investment (VC/PE/M&A), not opex. Menlo $37B is 2025 U.S. enterprise GenAI bottoms-up, excluding chips and hyperscaler inference.
Gartner YoY is +47% vs 2025 $1,764.9B. Infrastructure alone is $1,431.5B of the 2026 Gartner total. Models are $32.6B (+110% outlook).
IDC hardware path: $153B (2024) → $318B (2025) → $487B (2026f); >$1T by 2029f. Separate IDC product (~$1.3T by 2029 full-stack AI+GenAI) is not the hardware tracker.
Stanford AI Index 2026 (Apr 13, 2026): global corporate AI investment $581B in 2025 (+129.9% from $253B). US private $285.9B. Misuse alert: this is not a 2026 “market size.”
Menlo Dec 9, 2025: enterprise GenAI $37B (3.2× from restated $11.5B in 2024); app layer $19B; infra (Menlo definition) $18B. Scope exclusions matter more than the headline.
Secondary roundups (including Digital Applied, Jun 12, 2026) are navigational. Cite publisher + date + URL + definition every time.
The category error in one table {#category-error}
Three (really four) “AI market” numbers measure different economic flows. If you cannot state the flow in one sentence, you are not ready to put the number on a slide.
| Series | What it measures | Headline | Period | Source |
|---|---|---|---|---|
| Gartner | Full-stack AI procurement spend (infra + services + software + cyber + platforms + models + app dev + data) | $2.59T | 2026 forecast (+47% YoY) | Gartner, May 19, 2026 (Business Wire / Morningstar syndication) |
| IDC AI Infrastructure Tracker | Hardware only (AI-optimized servers, storage, networking) - excludes software/services | $487B | 2026 forecast (+53% YoY); 2025 actual $318B | IDC, Apr 16, 2026 (via Digital Applied synthesis Jun 12, 2026 citing primary) |
| Stanford AI Index 2026 | Corporate AI investment (VC/PE/M&A into AI companies) - not opex | $581B | 2025 actual (+129.9% from $253B in 2024) | Stanford HAI AI Index 2026, released Apr 13, 2026 |
| Menlo Ventures | Buyer-side enterprise generative AI spend (bottoms-up + survey) | $37B | 2025 | Menlo, Dec 9, 2025 |
Rule: Never add these into one “total AI market.” Secondary explainer that frames the conflict: Digital Applied, Jun 12, 2026 - *AI Spending Forecasts 2026: Gartner, IDC, Stanford Compiled*.
IDC also publishes a separate full-stack “AI + GenAI Spending Guide” (~$1.3T by 2029, ~31.9% CAGR). That is not the same product as the $487B hardware tracker. Saying “IDC says ~$500B” without naming the tracker is how analysts invent false conflicts with Gartner.
Series 1 - Gartner full-stack AI procurement {#gartner}
Publisher: Gartner, Inc.
Primary coverage: Business Wire / Morningstar syndication of the Gartner press release, May 19, 2026.
URL (syndication): https://www.morningstar.com/news/business-wire/20260519405832/gartner-forecasts-worldwide-ai-spending-to-grow-47-in-2026
Also cited: Gartner clients report *Forecast: AI Spending, Worldwide, 2025-2030, 1Q26*.
Use this series when you mean: what organizations will spend buying AI-related goods and services across the stack.
Worldwide AI Spending (Millions USD)
As republished from Gartner Table 1:
| Market | 2025 | 2026 | 2027 |
|---|---|---|---|
| AI Services | 436,351 | 585,527 | 759,418 |
| AI Cybersecurity | 25,920 | 51,347 | 85,997 |
| AI Software | 282,897 | 453,209 | 638,431 |
| AI Models | 15,494 | 32,604 | 59,161 |
| AI Platforms (DS/ML) | 21,292 | 29,928 | 42,639 |
| AI Application Development Platforms | 6,587 | 8,416 | 10,922 |
| AI Data | 826 | 3,126 | 6,480 |
| AI Infrastructure | 975,581 | 1,431,509 | 1,890,310 |
| Total AI Spending | 1,764,947 | 2,595,667 | 3,493,358 |
Operator notes
2026 total ≈ $2.60T, +47% YoY vs 2025 ≈ $1.76T (Appendix M01, M02, M04).
Infrastructure is >$45% of the 2026 total ($1,431.5B - M05). That is AI-optimized IaaS, servers, network fabric, semiconductors inside Gartner’s procurement frame - not identical to IDC’s hardware tracker.
Models outlook raised to +110% in 2026 (to $32.6B - M06) on agentic / multistep consumption. That is a models line item, not “agent software.”
Mid-year revision story (Jan ≈$2.52T / 44% → May $2.59T / 47%): scope widened; Gartner says cross-vintage comparisons “are not meaningful” (per Digital Applied citing Gartner). Do not build a narrative on vintage-to-vintage deltas without that caveat.
Agent software flag (secondary path): Digital Applied / CIO Dive-style coverage attributes to Gartner: purpose-built AI agent software $86.4B (2025) → $206.5B (2026) → $376.3B (2027) (~+139% then +82%). Treat as vendor-stated via secondary until confirmed in a Gartner primary PDF. It is distinct from the broader “AI Software” line ($453.2B in 2026) in the table above. If you put “$206B agents” on a slide, label the path.
Series 2 - IDC AI infrastructure hardware {#idc}
Use this series when you mean: AI-optimized servers, storage, and networking dollars - not software seats, not services SOWs, not model API bills.
| Metric | Figure | Notes |
|---|---|---|
| 2024 AI infra | $153B | Hardware tracker |
| 2025 AI infra | $318B | ≈+108% YoY (M08) |
| 2026 AI infra (f) | $487B | ≈+53% YoY (M07) |
| 2029 AI infra (f) | >$1T | ~31% 5-yr CAGR reported (M09) |
| Q4 2025 snapshot | $89.9B (servers $87.7B ≈97.6%; storage $2.2B) | US ~77% of that quarter |
Sources: IDC Worldwide Quarterly AI Infrastructure Tracker (Apr 2026 release cited widely); synthesis https://www.digitalapplied.com/blog/ai-spending-forecasts-2026-gartner-idc-stanford-compiled
Why Gartner infra ≠ IDC hardware. Gartner’s $1.43T “AI Infrastructure” is a procurement bucket inside a full-stack forecast. IDC’s $487B is a hardware tracker. Overlap exists (servers, fabric, storage), but the boxes are not coextensive. If a vendor deck says “the AI infra market is $1.4T-$0.5T depending on source,” make them name both definitions or reject the slide.
Supply-side ceiling note from the research dump: power, grid, and memory constraints are real risk flags on infra forecasts (IDC risk flags via Digital Applied). Treat long-range >$1T as a trajectory under those constraints, not a purchase order.
Series 3 - Stanford corporate AI investment {#stanford}
Source: Stanford HAI *AI Index 2026*, released Apr 13, 2026 (Quid data for the investment chapter).
| Metric | Figure | Notes |
|---|---|---|
| Global corporate AI investment 2025 | $581B | Incl. M&A; +129.9% vs $253B (2024) - M10 |
| Global private AI investment (ex-M&A) | ~$344.7B | Do not mislabel as US-only |
| US private AI investment | $285.9B | China $12.4B; UK $5.9B - M11 |
| US GenAI share of private | $163.6B | China+Europe GenAI combined ≈ $4.7B (reported) |
Misuse alert: Secondary posts often cite $581B as a 2026 market size. It is 2025 investment actuals - capital flowing into AI companies - not what enterprises spent on GenAI tools that year.
Operator translation:
Use Stanford when your question is “how hot is capital formation / M&A into AI?”
Do not use Stanford when your question is “what will my industry spend on copilots next year?”
Do not average Stanford with Gartner. Investment and procurement are different ledgers.
Series 4 - Menlo enterprise generative AI spend {#menlo}
Publisher: Menlo Ventures - *2025: The State of Generative AI in the Enterprise*
Date: Dec 9, 2025
URL: https://menlovc.com/perspective/2025-the-state-of-generative-ai-in-the-enterprise/
PDF: https://menlovc.com/wp-content/uploads/2025/12/menlo_ventures_enterprise_ai_report-2025-123125.pdf
Methodology: Survey of 495 U.S. enterprise AI decision-makers (Nov 7-25, 2025) + bottoms-up market model.
Scope exclusions (read twice): Excludes chips (e.g., Nvidia), hyperscaler inference/serving (AWS/GCP/Azure/Fireworks), and AI features bolted into existing non-AI software (e.g., Intuit Assist). 2023/2024 figures restated excluding inference for comparability.
| Metric | Figure |
|---|---|
| Enterprise GenAI spend 2025 | $37B (M12) |
| 2024 (restated) | $11.5B (M13) |
| 2023 (restated) | $1.7B |
| YoY | 3.2× |
| Share of global software / SaaS market (Menlo claim) | ~6% |
| Application layer | $19B (>50% of GenAI) - M14 |
| Infrastructure layer (Menlo definition) | $18B (was $9.2B in 2024) |
| Products >$1B ARR | ≥10 |
| Products >$100M ARR | ≥50 |
Application split (2025):
Horizontal AI: $8.4B (5.3× YoY) - copilots 86% ($7.2B); agent platforms 10% ($750M); personal productivity 5% ($450M)
Departmental AI: $7.3B (4.1×) - coding $4.0B (55%); IT $700M; marketing $660M; CS $630M; design 7%; HR 5%
Vertical AI: $3.5B (~3× from $1.2B) - healthcare ~$1.5B (43%); legal $650M; creators $360M; government $350M
Healthcare ambient scribes: $600M (+2.4×)
Infra split (Menlo definition): Foundation model APIs $12.5B; model training infra $4.0B; AI data/orchestration infra $1.5B.
This is the series you want for buyer-side GenAI product spend inside enterprises - the closest thing to “what did companies actually pay for GenAI applications and related infra (as Menlo defines it)?” It will look “small” next to Gartner’s $2.59T because it is designed to be a different box.
Other forecasts (expect conflict) {#conflict}
“GenAI market in 2030” is not one number. From the research dump’s conflict table:
| Publisher | Scope | Near-term | Longer-term |
|---|---|---|---|
| Bloomberg Intelligence | Generative AI (HW+SW+services+adjacent) | Hyperscaler capex could approach ~$750B in 2026; agentic AI spend could reach $286B by 2032 | $2.3T by 2032 (raised from prior $1.8T) - press Jun 4, 2026 |
| McKinsey Global Institute | Annual economic value of GenAI (not market revenue) | - | $2.6T-$4.4T / year across 63 use cases (2023 study - label vintage) |
| ABI Research | GenAI software | $63.7B (2025) → $93.9B (2026) | ~$220B (2030) |
| The Business Research Company | Narrower GenAI market | $34.3B (2025) → $47.3B (2026) | $129.8B (2030) |
| Stratpace Advisory | Foundation models (advisory estimate) | $30B (2024) → ~$120B (2026) | $420B (2030) - label as advisory |
| MarketsandMarkets | AI Agents | $7.84B (2025) | $52.62B (2030) |
| BCC Research | AI Agents | $8B (2025) | $48.3B (2030) |
| Information Matters | Agentic AI (independent build) | Central ~$40B (2026) (range $33-48B) | Base ~$140B (2030) |
| Research and Markets / TBRC-style | Broad “AI market” | ~$318B (2026) | ~$920B (2030) - scope ≠ Gartner |
Writer rule from the dump: “GenAI market in 2030” can mean ~$130B (TBRC), ~$220B (ABI software), ~$420B (Stratpace foundation-model stack), or trillions if you use Bloomberg’s broad GenAI / Gartner full-stack AI. Always define the box. Economic-value studies (McKinsey MGI $2.6T-$4.4T) are not revenue markets.
Which number for which claim (decision rules) {#decision}
Print this next to your slide template.
| Claim you want to make | Use | Do not use |
|---|---|---|
| “Worldwide AI procurement will hit ~$2.6T in 2026” | Gartner total (M01) | Stanford investment; Menlo GenAI |
| “AI hardware (servers/storage/network) is ~$487B in 2026” | IDC hardware tracker (M07) | Gartner total; Menlo |
| “Capital into AI companies was $581B in 2025” | Stanford AI Index (M10) | Any spend series |
| “U.S. enterprises spent $37B on GenAI products (Menlo box) in 2025” | Menlo (M12) | Gartner; IDC hardware |
| “GenAI apps (buyer-side) are a $19B layer” | Menlo app layer (M14) | Bloomberg 2032; Gartner models line |
| “Hyperscaler capex could approach ~$750B in 2026” | Bloomberg Intelligence (label) | Menlo; Stanford |
| “AI could create $2.6T-$4.4T annual economic value” | McKinsey MGI 2023 value study (label vintage + “value ≠ revenue”) | Any 2026 spend forecast |
| “Agent software is $206B in 2026” | Only with secondary-path labeling until Gartner PDF confirmed | Do not pass as Menlo agent platforms ($750M) |
Fast verbal test: If you can replace the number with “procurement / hardware / investment / enterprise GenAI product spend” and the sentence still parses, you have the right series. If the sentence only works with the vague noun “AI market,” rewrite the claim.
Citation cheatsheet - Appendix A M01-M14 {#cheatsheet}
Copy-paste for charts. Confidence and method notes are from the research appendix compiled 2026-09-02. Full URLs in References.
| ID | Metric | Value | Unit | As-of | Publisher | Method note | Confidence |
|---|---|---|---|---|---|---|---|
| M01 | Worldwide AI spend | 2595.7 | $B | 2026f | Gartner | Full-stack procurement | High (syndicated table) |
| M02 | Worldwide AI spend | 1764.9 | $B | 2025 | Gartner | Full-stack | High |
| M03 | Worldwide AI spend | 3493.4 | $B | 2027f | Gartner | Full-stack | High |
| M04 | AI YoY growth | 47 | % | 2026f | Gartner | vs 2025 | High |
| M05 | AI infrastructure spend | 1431.5 | $B | 2026f | Gartner | Sub-segment | High |
| M06 | AI models spend | 32.6 | $B | 2026f | Gartner | +110% YoY | High |
| M07 | AI infra hardware | 487 | $B | 2026f | IDC | Hardware tracker | Med-High |
| M08 | AI infra hardware | 318 | $B | 2025 | IDC | Hardware tracker | Med-High |
| M09 | AI infra hardware | >1000 | $B | 2029f | IDC | Hardware tracker | Med-High |
| M10 | Corporate AI investment | 581 | $B | 2025a | Stanford HAI | VC/PE/M&A | High |
| M11 | US private AI investment | 285.9 | $B | 2025a | Stanford HAI | Private investment | High |
| M12 | Enterprise GenAI spend | 37 | $B | 2025 | Menlo Ventures | Survey 495 + bottoms-up; excludes chips/hyperscaler inference | High |
| M13 | Enterprise GenAI spend | 11.5 | $B | 2024 | Menlo | Restated ex-inference | High |
| M14 | GenAI app layer | 19 | $B | 2025 | Menlo | Application layer | High |
Syndication URL for M01-M06: Morningstar/Business Wire Gartner May 19, 2026 press.
IDC path for M07-M09: Digital Applied Jun 12, 2026 synthesis citing IDC Apr 2026 tracker.
Stanford for M10-M11: AI Index 2026 (Apr 13, 2026).
Menlo for M12-M14: Dec 9, 2025 report + PDF.
Watch out / when NOT {#when-not}
Watch out
1. Vintage blending - Gartner Jan vs May 2026 outlooks are not cleanly comparable (scope widened). Do not chart “Gartner raised the market” as if definitions were frozen.
2. IDC product confusion - Hardware tracker ($487B) ≠ full-stack AI+GenAI Spending Guide (~$1.3T by 2029).
3. Stanford as spend - $581B is 2025 investment actuals. Saying “the 2026 AI market is $581B” is wrong on both year and category.
4. Menlo exclusions - Chips, hyperscaler inference, and bolted-in AI features are out. Comparing Menlo $37B to Gartner $2.59T without saying so is malpractice.
5. Agent software secondary - $206.5B (2026) agent-software path is secondary-attributed until a Gartner primary PDF confirms. Do not equate it with Menlo’s $750M agent-platform app spend.
6. Value ≠ revenue - McKinsey MGI $2.6T-$4.4T is economic value across use cases (2023). It is not a TAM you can sell into at 100% take rate.
7. Secondary aggregators - Use Digital Applied / blog roundups to find the primary; re-check the primary page before publish.
When NOT to use a “market size” slide
You cannot name the flow (procurement / hardware / investment / enterprise GenAI) in one sentence.
Your audience is a buyer deciding on a copilot seat budget - give them Menlo-layer or category spend, not Gartner’s full stack.
Your audience is a semiconductor / server diligence - start with IDC hardware, not Menlo GenAI.
Your audience is a fund diligence on capital formation - Stanford, not Gartner total.
You are tempted to average two series “to be conservative.” Averaging category errors does not create rigor.
FAQ {#faq}
What is the AI market size in 2026?
There is no single honest number. If you mean full-stack procurement, Gartner’s May 19, 2026 forecast is $2,595.7B (+47% YoY). If you mean AI hardware, IDC’s tracker is $487B (2026f). If you mean 2025 capital into AI companies, Stanford AI Index 2026 reports $581B. If you mean U.S. enterprise GenAI product spend (Menlo box), $37B in 2025. Pick the box; then cite it.
Why is Gartner ~$2.6T and Menlo only $37B?
Different universes. Gartner is worldwide full-stack AI procurement (infra through services). Menlo is a bottoms-up enterprise generative AI spend model with explicit exclusions (chips, hyperscaler inference, bolted-in AI features) and a U.S. enterprise survey backbone. Both can be “right” inside their definitions.
Can I add IDC $487B to Menlo $37B?
No. Overlap and non-overlap are messy; more importantly, they answer different questions. Adding them invents a third market that nobody measured.
Is Stanford’s $581B a 2026 forecast?
No. Stanford HAI AI Index 2026 (Apr 13, 2026) reports 2025 actual corporate AI investment ($581B, +129.9% from $253B in 2024). Do not relabel it as a 2026 spend forecast.
What share of Gartner’s 2026 total is infrastructure?
AI Infrastructure is $1,431.5B of $2,595.7B - more than 45% of the 2026 total in the syndicated table.
Where do “agent market” forecasts fit?
Separately, and they conflict. Examples in the research dump: MarketsandMarkets $7.84B → $52.62B (2030); BCC $8B → $48.3B; Information Matters central ~$40B (2026); Bloomberg agentic spend $286B by 2032; secondary Gartner agent-software path $206.5B (2026). None of these is Menlo’s $750M agent-platform application spend. Define agent vs copilot vs workflow before you quote.
What about PwC’s $15.7T by 2030?
That is a GDP contribution macro estimate, not a software TAM. Cite PwC primary when used; do not drop it next to Gartner procurement without labeling the category.
References {#references}
All accessed September 2026:
1. Gartner (via Business Wire / Morningstar syndication, May 19, 2026) - Gartner Forecasts Worldwide AI Spending to Grow 47% in 2026 (Table 1 segment dollars; M01-M06)
2. Digital Applied (Jun 12, 2026) - AI Spending Forecasts 2026: Gartner, IDC, Stanford Compiled (navigational synthesis; IDC hardware path M07-M09; vintage notes)
3. Stanford HAI - *AI Index 2026* (released Apr 13, 2026) - investment chapter / Quid data (M10-M11); search hai.stanford.edu AI Index 2026
4. Menlo Ventures (Dec 9, 2025) - 2025: The State of Generative AI in the Enterprise (M12-M14)
5. Menlo Ventures PDF - menlo_ventures_enterprise_ai_report-2025-123125.pdf
6. Bloomberg Intelligence press (Jun 4, 2026) - Generative AI market poised to reach $2.3 trillion by 2032…
7. Bloomberg Professional - Generative AI 2026 Outlook
8. McKinsey Global Institute (2023) - The economic potential of generative AI (value ≠ revenue; label vintage)
9. ABI Research - Generative AI software market report summary
10. The Business Research Company - Generative AI Global Market Report
11. MarketsandMarkets - AI Agents Market
12. BCC Research - AI Agent Market
13. Information Matters - Agentic AI market report forecast Q1 2026 PDF
14. Research and Markets - Artificial Intelligence Market Report (scope ≠ Gartner)
15. Stratpace Advisory - Global generative AI foundation models outlook to 2030 (advisory estimate - label)
16. Vantaige research dump -
/workspace/vantaige-ai-market-research-2026.md(compiled 2026-09-02; Appendix A M01-M14)
Related from Vantaige {#related}
Coming on Vantaige: The Agentic ROI Gap (2026): Why Gartner Says >40% of Agent Projects Cancel While Spend Explodes - cancel prediction vs agent spend, McKinsey 89/37/6, MIT 95%, Menlo 16% true agents.
Coming on Vantaige: Coding Ate Enterprise AI - Menlo’s $4B coding layer and seat-vs-API TCO.
Coming on Vantaige: Buy, Don’t Build - Until Regulation Forces Receipts - Menlo 76% purchased + EU AI Act Article 50.
Tools on Vantaige: AI ROI Calculator, AI Stack Builder.
---
One short email a week: the forecasts that survive diligence, the category errors that do not, and the “when NOT” notes vendors skip. Subscribe at vantaige.io.
*Written as Aymen B for Vantaige.io - 2 September 2026 (ICT). Operator research note, not investment advice. Re-check primary links before you put a number on a board slide.*
Get the best new AI tools and guides, weekly
One short email a week. The tools worth trying, the guides worth reading, nothing else.
No spam. Unsubscribe anytime.
Aymen B
Contributing writer at Vantaige, covering the AI tools ecosystem.
Similar articles
Vantaige Launches the LLM VRAM Calculator: A Free GPU Compatibility Finder for Open-source and Open-Weight AI
Xiaomi MiMo-V2.6 Deep Dive: The 1-Trillion-Parameter Open-Source Titan Disrupting the Frontier