TAM SAM SOM Market Sizing With Perplexity: The Sourcing Pattern That Survives Pushback (2026)
TAM SAM SOM Market Sizing With Perplexity: The Sourcing Pattern That Survives Pushback (2026)
Most pitch decks die on the market-size slide. Not because the numbers are wrong, but because the sourcing is thin: one analyst number, no derivation, no cross-check. A skeptical investor or corp-dev reviewer asks "where did that come from?" and the slide collapses. The fix is not a bigger number. It is a triangulation pattern that combines three independent methods, captured in real time with a tool like Perplexity. This guide shows you the exact pattern, the prompts, and a worked example you can adapt today.
TL;DR
TAM is the whole market; SAM is the reachable share; SOM is your realistic capture in 3-5 years
Top-down alone invites the "where did that come from" question and fails diligence
Triangulate three independent methods and show where they converge
Perplexity with cited sourcing is the fastest way to build a defensible evidence file
Investors trust derivations, not round numbers from a single report
What are TAM, SAM, and SOM?
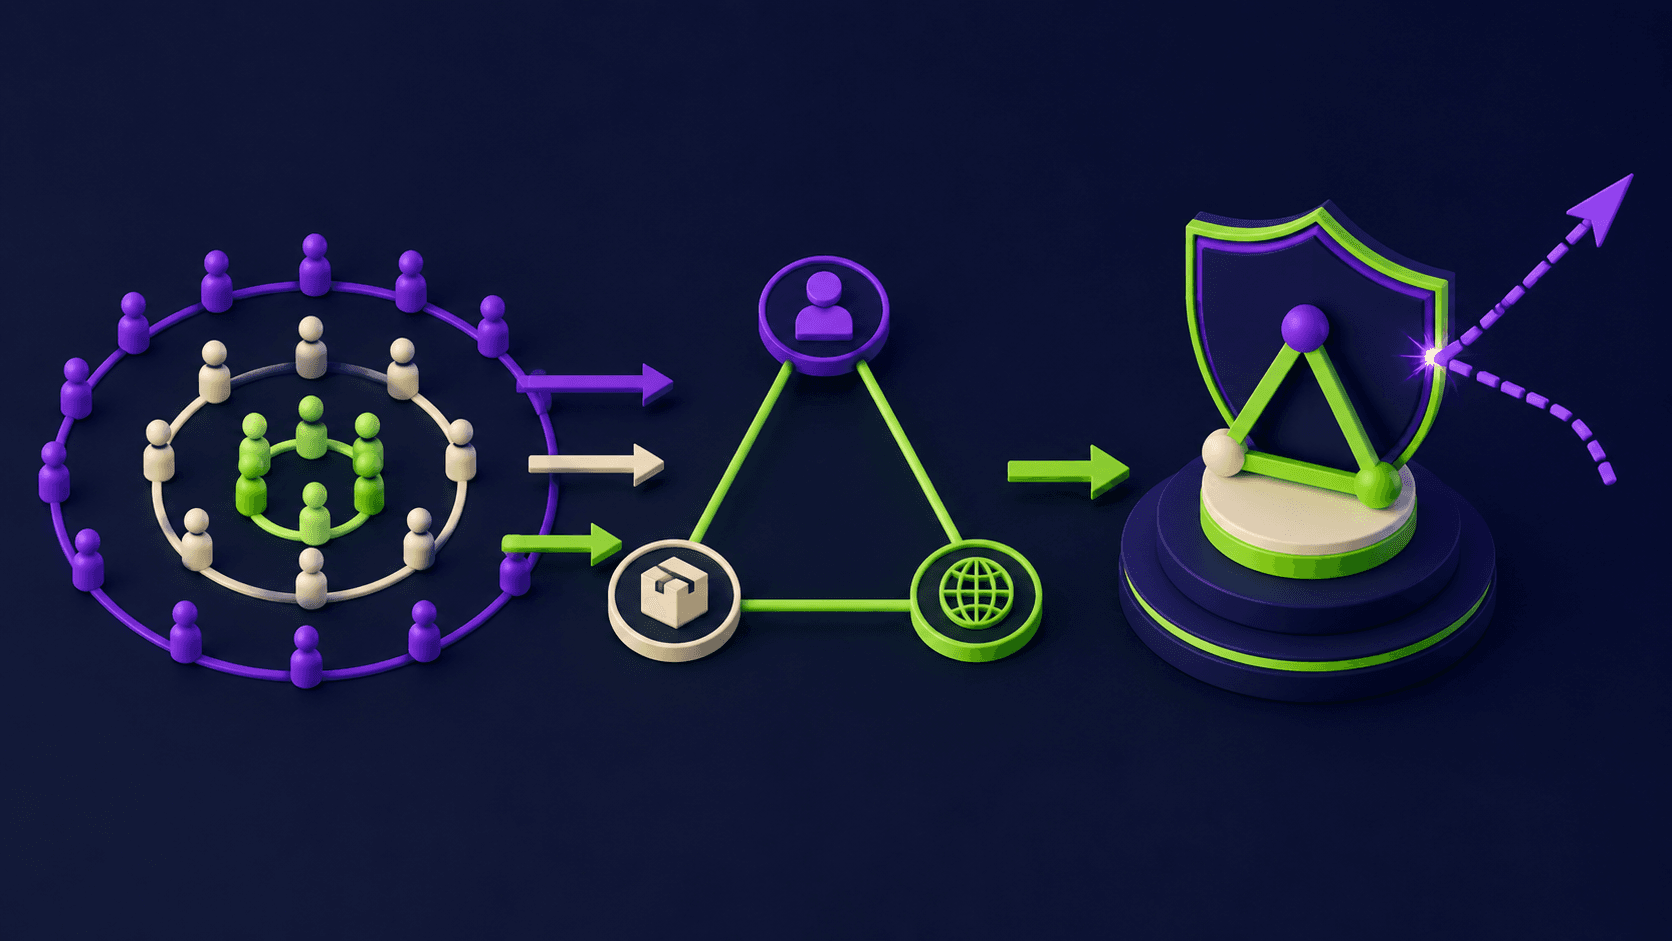
TAM (Total Addressable Market) is the total revenue opportunity if you sold to every possible customer in the category globally. SAM (Serviceable Addressable Market) is the portion you can actually reach given your geography, product scope, and go-to-market. SOM (Serviceable Obtainable Market) is the realistic share you can capture within roughly three to five years given your team, budget, and competitive position. The three numbers form a funnel: TAM sets the ceiling, SAM defines your lane, SOM is the number you are actually held to.
The mistake most decks make is stopping at TAM and presenting one number as if it answers all three questions. Investors know the difference. If you claim a $40B TAM and a $50M SOM with nothing in between, the slide reads as a copy-paste from a Gartner headline and earns immediate skepticism. Each tier needs its own derivation, and the logic connecting them is what makes the slide hold up.
Why top-down sizing alone gets you eaten alive
Top-down sizing starts with a published industry total from an analyst report (Gartner, IDC, Statista, CB Insights) and claims a percentage of it. It is fast and looks authoritative, but it is the most fragile method in a diligence conversation. The moment a reviewer asks "what methodology did that analyst use?" or "how do you know you can reach that segment?" the answer is usually silence.
The structural problem is that analyst market totals are often defined differently from your actual category. A $10B "workflow automation" market from 2023 includes players who are not your competitors and excludes segments where you actually win. When you quote it without derivation, you are borrowing authority you have not earned. Investors who have seen hundreds of decks recognize this pattern immediately. Top-down is a useful sanity check and a good starting anchor, but it cannot stand alone. You need at least two independent methods pointing to the same neighborhood.
The triangulation pattern: top-down plus bottom-up plus comparable funding
The pattern that survives diligence uses three independent methods and shows where they agree. Agreement between methods is evidence. Disagreement is a prompt to understand why, which also demonstrates command of your market. The table below defines each method, how to calculate it, where to get the data, and where it breaks down.
Method | How you calculate it | Data source | Its weakness |
|---|---|---|---|
Top-down | Take a published industry total, filter it to your SAM segment (geography, product fit, buyer type), then apply a realistic capture rate for SOM | Gartner, IDC, Statista, CB Insights, trade associations, government SIC/NAICS data | Analyst definitions rarely match your exact category; the methodology is opaque; numbers can be 2-3 years stale |
Bottom-up | Count the addressable customers (from a database like Apollo or LinkedIn), multiply by realistic ACV or average spend per customer, and sum | LinkedIn Sales Navigator, Apollo, Crunchbase for company counts; your own deal data or competitor pricing pages for ACV | Customer counts can be over-inclusive; ACV assumptions need validation from real deals or public benchmarks |
Comparable funding | Find 3-5 funded companies in adjacent or analogous categories; back-calculate implied market from their valuations and revenue multiples; use as a cross-check on the other two | Crunchbase, PitchBook (or public filings), CB Insights funding data, press releases | Comparables may be in different geographies or at different stages; multiples compress in down markets |
When all three methods land in the same range, you have a defensible slide. When they diverge, you have an honest conversation to have: "our bottom-up comes in lower than the analyst total because we're focused on the mid-market segment, not enterprise." That kind of specificity is what separates founders who understand their market from those who Googled a number.
For teams building financial and strategic analysis workflows, the finance and legal AI tools directory covers the full stack from research to modeling.
How to capture sources in real time with Perplexity without losing your train of thought
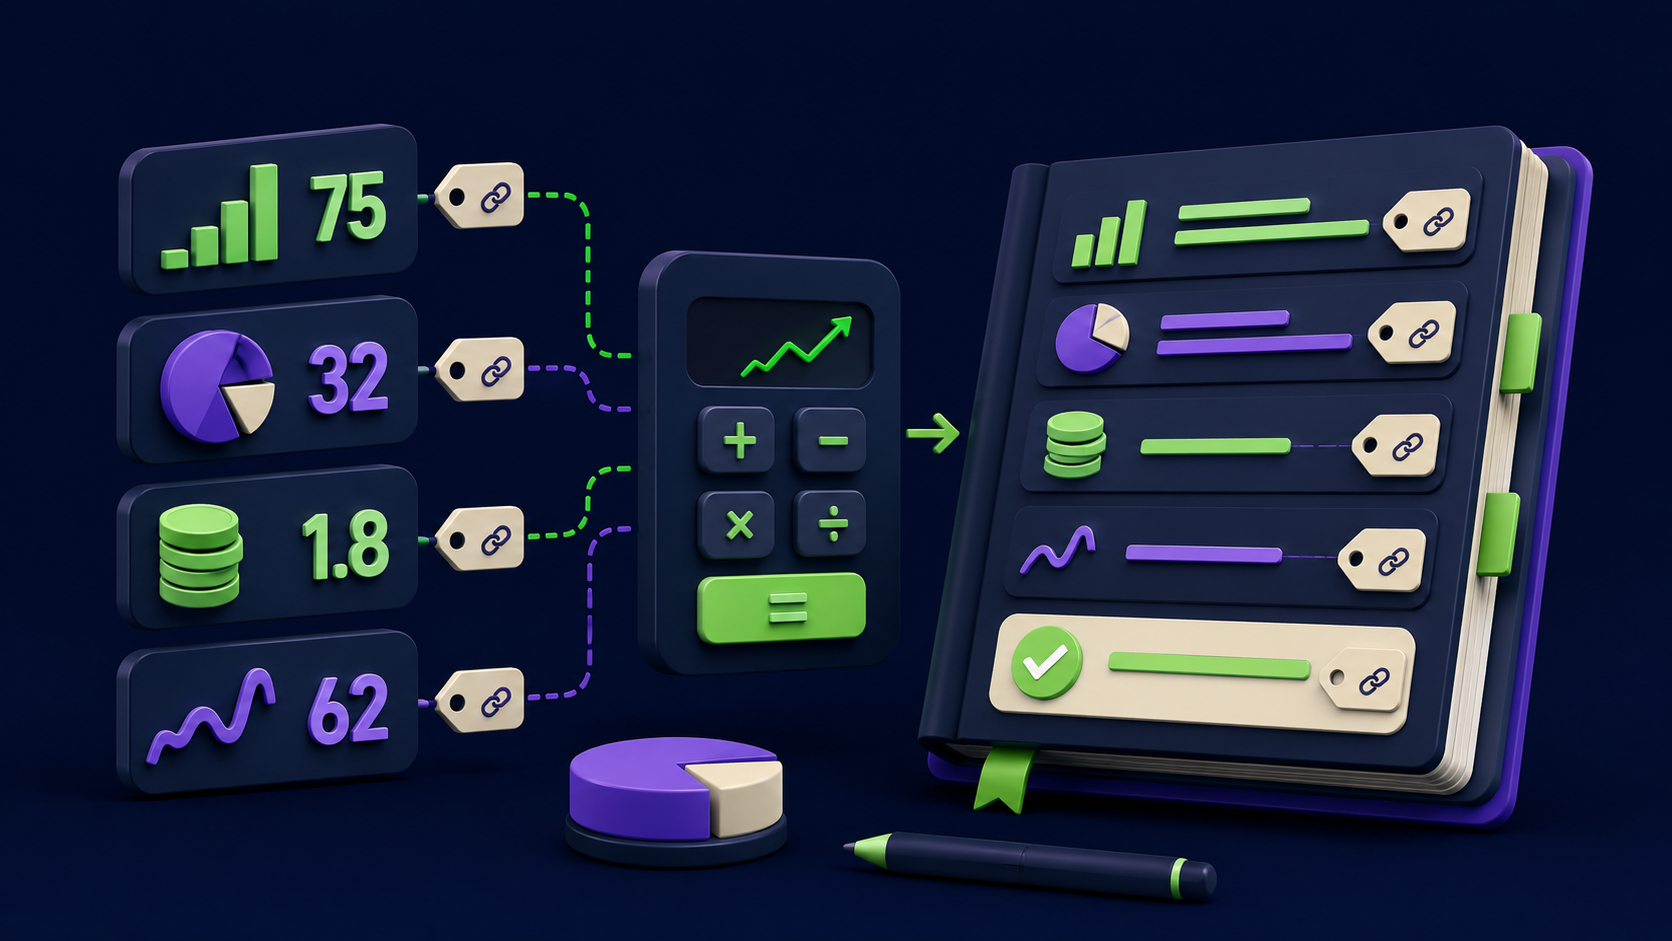
Perplexity is purpose-built for exactly this workflow: it searches, synthesizes, and cites inline, so you can build an evidence file while you think rather than context-switching to Google for each data point. The key is writing prompts that extract the specific number you need with the source attached, not prompts that ask for an opinion on market size.
Here are the exact prompts to run for each triangulation method. Copy them as written, then adjust the category and geography to your situation.
Top-down prompt: "What is the total addressable market for [your category] in [geography] in 2024 or 2025? Cite the analyst firm, report title, and publication year for each number you include. If multiple estimates exist, list all of them."
Bottom-up prompt: "How many companies in [geography] fit this profile: [industry], [headcount range], [technology or process indicator]? Cite the source (LinkedIn, Crunchbase, Apollo, trade body) and state the query or methodology used to arrive at the count."
ACV/pricing benchmark prompt: "What is the average contract value or annual spend per customer for [your product category] at [SMB / mid-market / enterprise]? Cite public pricing pages, analyst benchmarks, or disclosed deal data."
Comparable funding prompt: "List 3 to 5 venture-funded companies in [adjacent category] with disclosed valuations or revenue multiples. Include funding round, year, and the implied revenue or market size that backs the valuation. Cite Crunchbase, PitchBook announcements, or press releases."
For each prompt, Perplexity returns inline citations you can click through and verify. Save the full output to a running document: that document becomes your sourcing appendix, which you share with diligence teams if asked. The Perplexity research workflow tutorial covers how to structure multi-step research sessions so sources stay organized.
One discipline that matters: run each prompt fresh, without chaining it from a prior answer. Perplexity's sourcing is strongest when the query is independent. If you ask "now use that to calculate my SAM," the model synthesizes rather than sources, and the citations get weaker. Each method gets its own prompt and its own evidence block.
The "would this pass diligence" checklist
Before you present the market-size slide, run this checklist. A "no" on any item means the slide needs work before it goes in front of a serious investor or a corp-dev team running a formal process.
TAM: is it sourced from a named, dated report or a derivable calculation? A bare number with no attribution fails.
SAM: have you filtered TAM down by at least two real constraints (geography, segment, buyer type)? "We serve the US mid-market" is a filter. "We could sell to anyone" is not.
SOM: is it derived from your bottom-up customer count and ACV, not just a percentage of SAM? Percentages feel invented. A customer count times an ACV feels real.
Cross-check: do two of your three methods land within 2x of each other? Wider divergence means you do not yet understand the market well enough.
Sources: can you name the source for every number in under 10 seconds? If you have to look it up mid-meeting, you do not own the numbers.
Timeliness: are your sources from 2023 or later? Markets move. Stale data undermines credibility even if the number is technically correct.
A worked example: vertical SaaS defending a roughly $50M SOM
The following numbers are illustrative. They show the triangulation pattern working on a fictional vertical SaaS product serving independent insurance agencies in the US. Use the logic; replace the numbers with your actual research.
Scenario: You are building a policy-management and renewal automation tool for independent insurance agencies. You are raising a Seed round and defending a $50M SOM on your deck.
Top-down method (illustrative): A 2024 IBIS World report on insurance software in the US puts the category at roughly $8B in annual revenue. Independent agencies represent approximately 35 percent of the insurance distribution channel (Independent Insurance Agents and Brokers of America, 2023 data). That implies a $2.8B SAM. At a 2 percent capture rate over five years (a standard conservative assumption for a Series A-stage business), SOM is $56M. Top-down anchor: $56M.
Bottom-up method (illustrative): A LinkedIn Sales Navigator query for "insurance agency" businesses with 2-20 employees in the US returns approximately 55,000 firms (illustrative count). Independent agencies with active commercial and personal lines books of business number closer to 38,000 after filtering for size and book composition. At an illustrative ACV of $1,400 per agency per year (based on comparable workflow-SaaS pricing for similar SMB verticals), the bottom-up SAM is $53M. Bottom-up anchor: $53M.
Comparable funding method (illustrative): Applied Systems (enterprise insurance management) raised at valuations implying $500M-plus revenue; not comparable. Agency Zoom (independent agency CRM) raised a $4.5M seed in 2021, implying early-market validation at sub-scale. EZLynx (agency management) was acquired for a reported $90M in 2017 (Vertafore press release), representing a prior-generation platform at maturity. The comparable set implies a reachable market large enough to support a $20M-plus exit on a niche product, and $50M-$100M in annual revenue is plausible for a focused vertical winner. Comparables confirm the range is defensible; they do not produce a precise number. Comparables anchor: consistent with $50M SOM.
Convergence: Top-down ($56M) and bottom-up ($53M) land within 6 percent of each other. Comparables are directionally consistent. The $50M SOM on your deck is conservative relative to both primary methods and defensible from three independent angles. You can present the derivation, not just the number.

FAQ
What is the difference between top-down and bottom-up market sizing?
Top-down starts with a published industry total and filters down. Bottom-up starts with a count of reachable customers and multiplies by a realistic spend figure. Top-down is faster but harder to defend because the analyst methodology is opaque. Bottom-up is more work but produces a number you can trace back to real assumptions. For any deck going to a sophisticated investor, both methods should produce numbers that broadly agree.
What if there is no analyst report for my category?
Build from the bottom up first. Count your addressable customers using LinkedIn, Apollo, or Crunchbase filters. Estimate ACV from comparable products in adjacent categories. Then construct a proxy top-down by sizing the problem you solve: if you automate a process that currently costs X per year and you capture Y percent of that spend, that is a valid top-down derivation even without a named report. Acknowledge the absence of analyst coverage and explain your methodology. That transparency is more credible than a vague citation.
How do you size a market when the category does not exist yet?
Anchor to the problem, not the product. If your tool replaces a manual workflow, size the labor cost of that workflow across your addressable customer base. If it enables a new capability, size the nearest proxy market and argue for a substitution or expansion effect. Investors understand new categories need proxies. What they will not accept is a number with no derivation at all.
How precise does a market size number need to be?
Precise enough to be directionally trustworthy, not precise enough to be falsifiable. Saying "$52.7M SAM" implies false precision; saying "$50-60M" with two methods behind it is honest and more credible. The goal is to show you understand the market structure, not to win on significant figures. Investors are pattern-matching on "does this person know their market" more than on the exact number.
What sources do investors actually trust?
Named analyst firms (Gartner, IDC, Forrester, CB Insights) for top-down anchors. Your own deal pipeline or signed customers for ACV validation. LinkedIn and Apollo for customer counts. Crunchbase and PitchBook for comparable funding. Government data (Census Bureau industry codes, BLS employment data) for count-based bottom-up work. Investors trust derivations more than sources: showing your work matters more than having a famous name on the report.
Can Perplexity cite paywalled reports?
Perplexity surfaces publicly available summaries and press coverage of paid reports, but it cannot access the full text of paywalled analyst research. If an IDC or Gartner number appears in a press release or a vendor blog, Perplexity can cite that secondary source. For primary analyst data, you would need a direct subscription or a one-off report purchase. In most early-stage decks, publicly available secondary sources are sufficient. What matters is that the source is real and you can verify it if challenged. See the Perplexity research tutorial for strategies to maximize what you can pull without a paywall.
Does this approach work for corp-dev and business cases, not just fundraising?
Yes, and in some ways it matters more there. A corp-dev team doing acquisition diligence or a strategy team building a business case for a new product line will run the numbers themselves. If your sourcing is thin, they will find better numbers and your credibility drops. The triangulation pattern and the sourcing discipline in this article apply equally to internal investment cases, M&A support, and market entry analysis. For teams using AI tools across finance and strategy workflows, the finance and legal tools hub is a useful reference. The operator playbook on building and selling AI automations also covers how to price and size service markets using similar methods.
How many sources should back each method?
At least two independent sources per method, ideally from different types (one analyst, one primary data source). For bottom-up, your customer count and your ACV should each have a source. Single-source numbers are fragile in a diligence conversation. Two sources that agree give you something to say when challenged; two sources that disagree give you an opportunity to explain the delta, which also demonstrates market knowledge.
Related from Vantaige
Need a sourced market sizing model built fast?
Vantaige builds research and analysis workflows that pull live data, apply the triangulation pattern, and output a sourced model you can share with investors or a board. If you are preparing a raise, a business case, or a market entry analysis and want the work done rigorously, book a free automation audit and we will scope what fits your timeline.
References
Perplexity AI, product overview and search methodology. perplexity.ai
CB Insights, market sizing and venture data methodology. cbinsights.com
Statista, industry and market statistics database. statista.com
First Round Capital, resources on startup market sizing. firstround.com
Andreessen Horowitz (a16z), market analysis and investment frameworks. a16z.com
Get the best new AI tools and guides, weekly
One short email a week. The tools worth trying, the guides worth reading, nothing else.
No spam. Unsubscribe anytime.
Aymen B
Contributing writer at Vantaige, covering the AI tools ecosystem.