How to Measure Activation and Retention in an AI Product
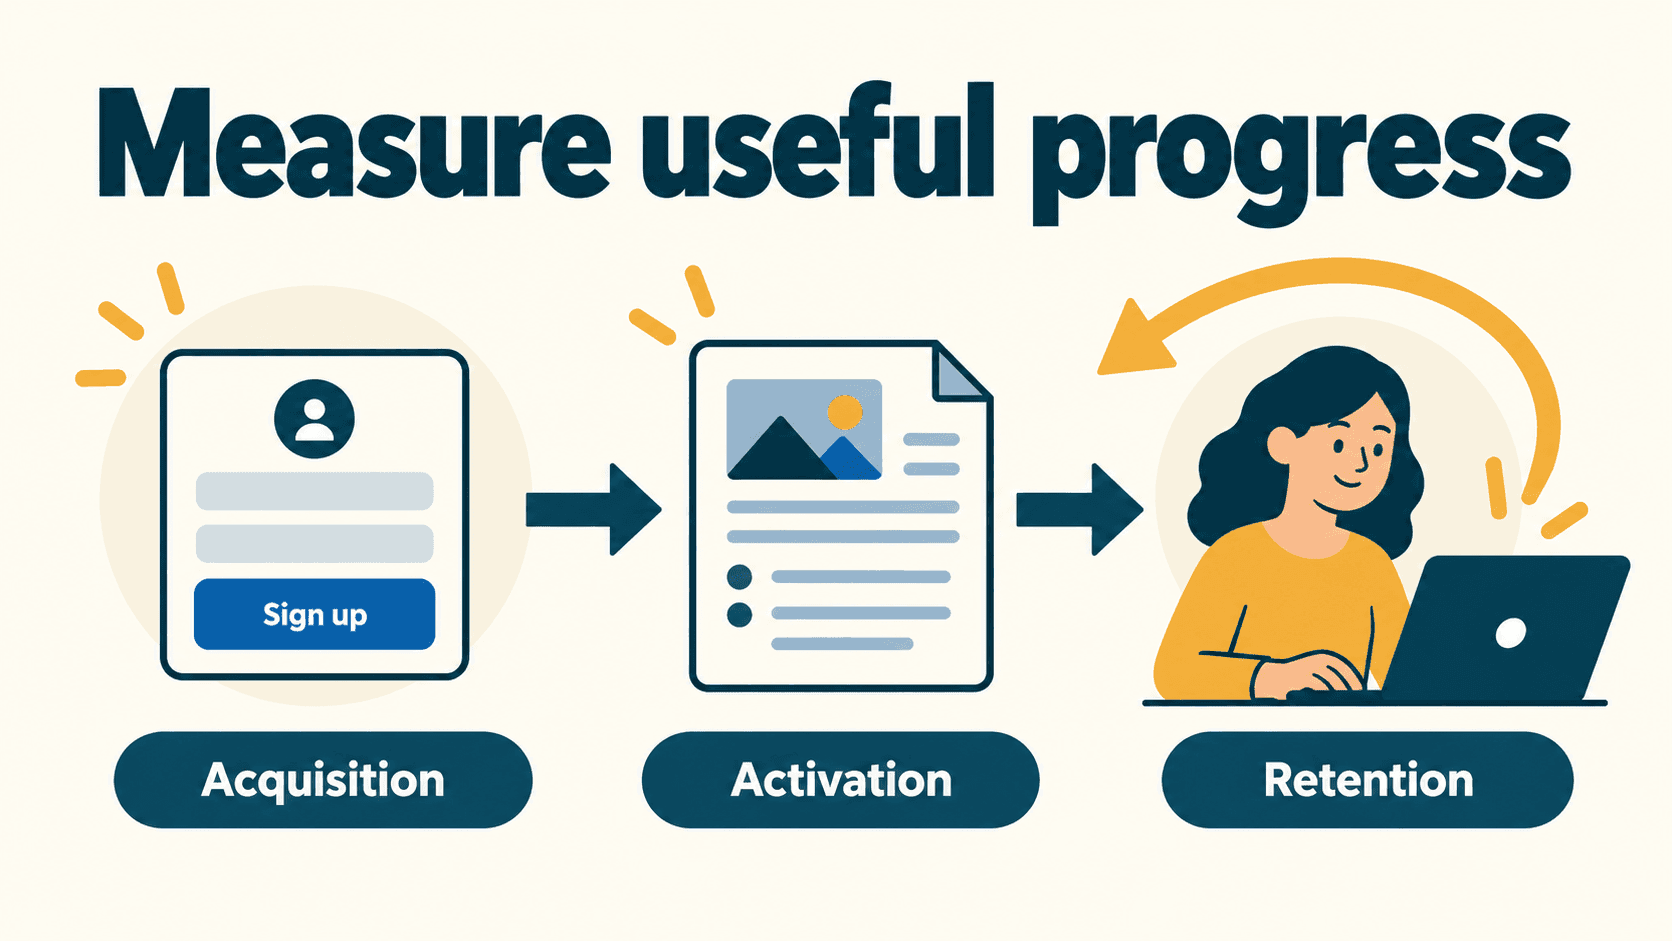
Choose an activation event that represents a useful customer job, then measure whether the same users return to do another one. Define the eligible population, event, denominator and time window before comparing rates. Keep attempts, delivered drafts and accepted outputs separate.
This guide uses a fictional research assistant and synthetic cohort counts. It includes an event contract and a weekly review template. The numbers are teaching inputs, not Vantaige traffic, customer results or evidence of a successful product change.
Define first value without overstating what an event proves
In the example app, a user supplies documents and asks for a source-linked brief. After reviewing it, the user can choose Mark brief usable. That explicit action is the example's acceptance event.
Acceptance means the user took that declared action. It does not independently verify every citation or establish that the brief changed a business outcome. Measure factual quality separately when it matters.
Exporting, copying or saving can be useful adoption signals, but they are proxies. Someone may export a draft to correct it elsewhere. If you use one as your activation criterion, name the metric accordingly and document why you chose it.
| Event family | Useful question | Limit |
|---|---|---|
| Eligible signup | Who entered the population? | Signup alone is not first value |
| Task requested | Who attempted the product's job? | Request does not prove execution or delivery |
| Attempt finished | How did an execution attempt end? | Technical completion is not acceptance |
| Draft available | Could the user review an output? | Availability does not prove the user saw it |
| Output accepted | Who marked a result usable under the chosen rule? | Not an independent quality assessment |
| Output rejected | What explicit failure reason was recorded? | Missing feedback does not establish abandonment |
Choose eligibility based on the product's intended use and access. Exclude declared staff/test traffic consistently. A personal email address does not make a solo founder an unqualified user.
Make the user journey inspectable
The fictional journey is simple:
- An eligible user signs up.
- The app records a logical task request.
- One or more execution attempts produce a draft or a failure.
- The user reviews the draft and may mark it usable or reject it.
- On a later, distinct task, the user may repeat the accepted outcome.
A retry is not another user. A redownload of the same accepted brief is not another useful task in this metric. Preserve task_id and attempt_id so execution activity does not inflate product adoption.
A gap between requested and delivered work is a place to investigate. It does not automatically prove a provider failure: jobs can be queued, canceled, unresolved or missing telemetry. Similarly, a delivered draft without an acceptance event might reflect an unusable answer, a confusing interface, a delayed review or an event-capture problem. Inspect evidence before assigning the cause.
Write an event contract before adding charts
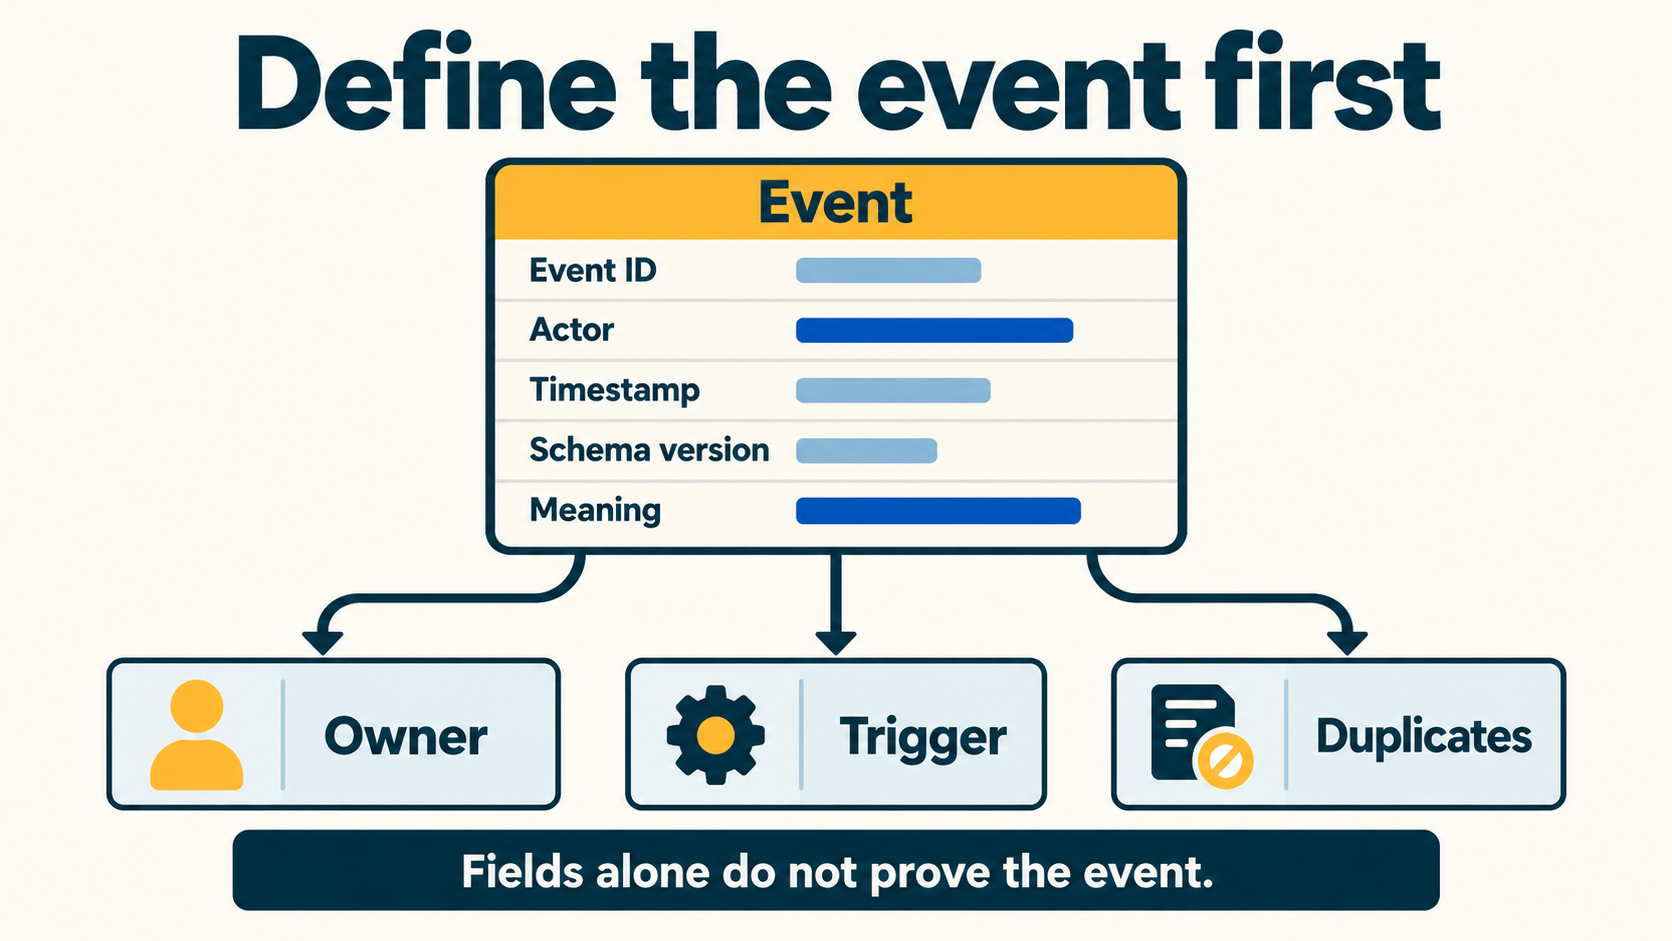
Download the activation event contract. It defines triggers, required identifiers, producer ownership and deduplication rules.
Keep stable identifiers for the user, logical task, attempt when applicable, and individual semantic event. Include event time, ingestion time and schema/rule versions. Keep the same event_id when retrying transport of the same event; a different lifecycle event gets a different ID even when it belongs to the same task.
Here is an application-level example, not an analytics vendor's HTTP API payload:
{
  "event_id": "evt_demo_accept_02",
  "event_type": "output_accepted",
  "user_id": "user_demo_01",
  "task_id": "task_demo_02",
  "occurred_at": "2026-10-03T10:00:00Z",
  "schema_version": 1,
  "acceptance_rule": "mark_usable_v1"
}
These identifiers are opaque example strings. The contract does not require them to be UUIDs. Add account/workspace context if needed, while keeping the analysis unit explicit: this article counts individual users, not paid accounts or seats.
Two documented implementation methods
PostHog's event-capture documentation describes named custom events with properties. Adapt that method by mapping your application contract into supported capture calls and checking the received event. An event name alone does not supply the business meaning; define that meaning in your contract.
PostHog's retention documentation describes choosing a start event, a return event, user or group units, intervals and cohort options. Adapt that method by configuring the exact population and return rule you intend to report. Different start criteria or return intervals produce different metrics. A default retention chart may not implement the activated-user denominator used below. Apply the required cohort/query logic in your chosen system and validate it against a small application dataset before treating the chart as this metric.
These documented workflows illustrate how to structure event tracking; verify current SDK signatures when implementing in your analytics provider.
Keep activation and return denominators explicit
For this synthetic example, use these rules:
- Unit: distinct eligible individual user.
- Time zero: that user's first eligible signup timestamp, called
t0. - Activation: at least one distinct task accepted during
[t0, t0 + 7 days). - Day 7 return: an activated user accepts another distinct task during
[t0 + 7 days, t0 + 8 days). - Week 1 return: an activated user accepts another distinct task during
[t0 + 7 days, t0 + 14 days). - Week 2 return: an activated user accepts another distinct task during
[t0 + 14 days, t0 + 21 days).
Square bracket means the starting boundary is included; parenthesis means the ending boundary is excluded. A day here is 24 hours, with timestamps normalized to UTC. These are elapsed-time windows from signup, not calendar-week activity or windows from first acceptance.
activation_rate = activated_users / eligible_signups
week1_return_rate = activated_users_with_return_in_week1 / activated_users
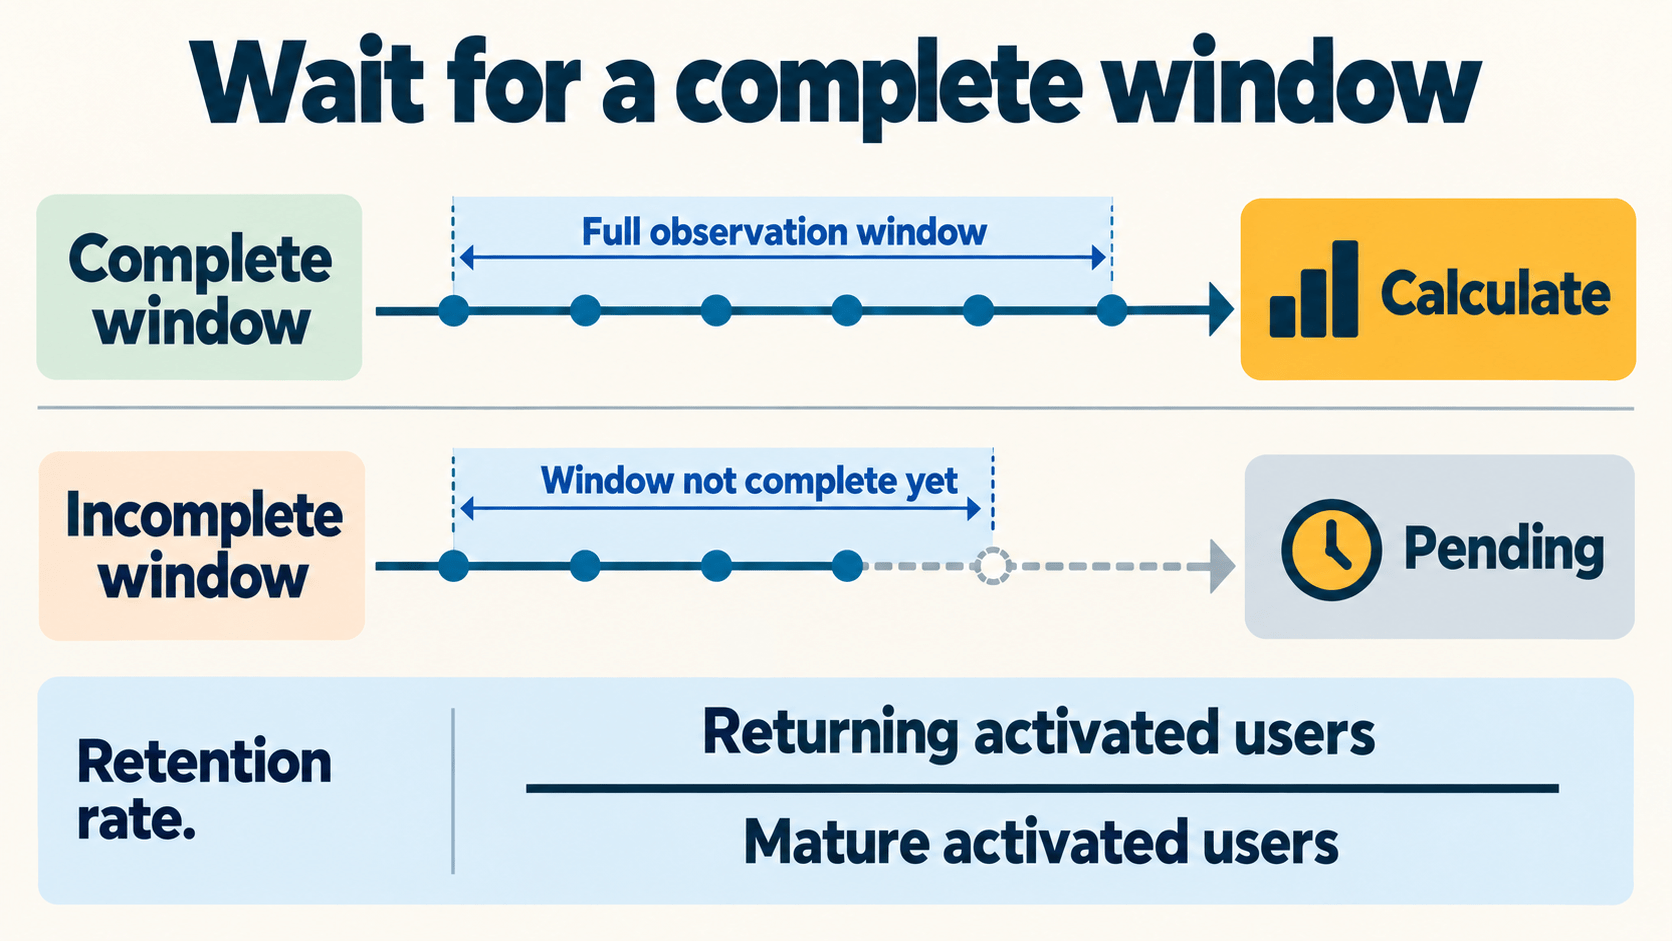
A user contributes at most once to each numerator. When the relevant denominator is zero, the rate is undefined. When follow-up time is incomplete, the full-cohort metric is pending. Neither case is a measured 0%.
The chosen Week 1 numerator is a subset of activated users, not all signups who happened to use the app later. A first-ever accepted task on day 9 is late activation under this definition, not a return by a first-week activated user.
Check maturity for each metric
Weekly signup cohorts contain users with different signup times. A cohort's newest user must have enough follow-up for a full-cohort window to close. Do not mark a whole cohort “mature” merely because its oldest users have returned.
The supplied fixture uses a cutoff of 27 October 2026 at 00:00 UTC. Its counts are invented aggregates, not a raw-event extract. The CSV records the signup range, window-close bounds, cutoff and per-metric status.
| Signup dates, UTC | Eligible | Activated within 7 days | Activation | Week 1 return | Week 2 return |
|---|---|---|---|---|---|
| Sep 28–Oct 4 | 40 | 20 | 50.0% | 8/20 = 40.0% | 6/20 = 30.0% |
| Oct 5–11 | 48 | 24 | 50.0% | 10/24 = 41.7% | pending |
| Oct 12–18 | 52 | 26 | 50.0% | pending | pending |
| Oct 19–25 | 50 | pending | pending | pending | pending |
For the Oct 5–11 cohort, the conservative full-cohort Week 1 close is 26 October, while Week 2 closes 2 November. It is appropriate to show the first result and leave the second pending at the fixture cutoff.
For Oct 12–18, activation closes 26 October, but Week 1 does not close until 2 November. Its activation can be reported while Week 1 remains pending. The CSV also includes the separate Day 7 metric; do not confuse it with returning anywhere during Week 1.
Download the synthetic cohort worksheet and metric definitions to inspect the counts and close dates. In a real pipeline, compute from the actual per-user timestamps, document late-arriving events and version any revised extracts. If reporting a partially observed subgroup, label its population and denominator separately rather than presenting it as the completed cohort.
Verify collection and retries
Use an authenticated application path to record meaningful task states. A browser click can express intent; it does not establish that a backend task was admitted or that an acceptance record was persisted.
Test the event journey with synthetic records:
- Create one eligible test user and one logical task.
- Record its request, attempts, draft and acceptance through the intended producers.
- Retry delivery of one event with the same
event_id. - Confirm lifecycle events remain distinct and duplicate delivery does not change unique-user/task counts.
- Confirm a second distinct accepted task can count as return in the declared window.
- Compare application state with analytics records and inspect missing/late events.
Use this test sequence to validate your telemetry before launch. An accepted-event semantic key can help prevent duplicated business records, but a global deduplication key of task_id alone would wrongly collapse request, completion and acceptance events into one.
Collect only fields needed for the measurement. The example contract excludes raw prompts, documents and outputs. IDs and metadata can still be sensitive or linkable; apply appropriate access, retention and collection settings rather than calling them anonymous by default. Review automatic capture separately from custom events.
Turn the weekly review into a decision
Use the weekly metrics review template at a cadence that fits the product's natural use. A weekly research task and a daily support workflow need not share the same return interval.
Start by checking the extract, event definitions and mature windows. Then ask which gap is worth investigating:
| Observation | Possible explanations to check | Useful next evidence |
|---|---|---|
| Fewer eligible users request a task | Unclear starting path, wrong audience, capture issue | Onboarding path and authorized user feedback |
| Requests lack available drafts | Queuing, cancellation, failures or missing events | Job/attempt state reconciliation |
| Drafts lack acceptance | Task fit, quality, interface or delayed review | Review decisions and specific rejection reasons |
| Mature activated users return less | Task frequency, changed audience, poor repeat value | Cohort mix, distinct returned tasks and feedback |
These are hypotheses, not diagnoses. Choose one change, record why it might help, identify the metric and guardrails, and decide when enough follow-up will exist to review it. Preserve the product and metric versions.
If retention depends on email or social follow-up, beehiiv and Hypefury cover newsletters and scheduling. Their Vantaige listings (beehiiv, Hypefury) show current plans. Change one retention input at a time.
Interpret small samples with counts
In the first synthetic cohort, Week 1 return is 8 of 20 activated users, or 40%. One additional returning user would make it 9 of 20, or 45%. That 5 percentage point difference is one person, not proof a release improved retention.
Likewise, activations rise from 20 to 26 between the first and third example cohorts because eligible signups rise from 40 to 52. Both activation rates are 50%. Volume and rate answer different questions.
Do not declare every small movement noise or every larger count traction. Consider sample size, audience mix, uncertainty and the decision being made. A causal test needs an appropriate design and sufficient data for its question; this guide supplies no universal sample-size rule or mandatory four-week baseline.
Use direct, authorized feedback and task-level evidence to understand observed problems while the cohort matures. Do not invent a successful follow-up cohort, interview or model improvement to complete the story.
Start with the event contract. Choose one explicit first-value criterion and one return window, test the collection path, then report counts and pending states alongside the rates.
Get the best new AI tools and guides, weekly
One short email a week. The tools worth trying, the guides worth reading, nothing else.
No spam. Unsubscribe anytime.
Aymen B
Contributing writer at Vantaige, covering the AI tools ecosystem.